
Abstract
We propose a simple mechanical model describing viscoelasticity, cavitation growth and crack propagation during the debonding process in pressure-sensitive adhesives (PSAs). Typical materials of PSA are made of block copolymers and they are usually very soft and highly dissipative, and can stick on a variety of surfaces under low pressure in short time. The debonding process of PSA is governed by very complicated dynamics, for example, deformation of the adhesive layer, cavity expansion and coalescence. Our model is a modified version of that proposed by Yamaguchi et al (2006 Eur. Phys. J. E 20 7). We extended his simple model to be applicable to the final rupture process and applied the model to some cases, where we studied the effects of the change of PSA layer's thickness, separation speed and friction coefficient. Our results are qualitatively in good agreement with the experimental data.
Export citation and abstract BibTeX RIS

Content from this work may be used under the terms of the Creative Commons Attribution 3.0 licence. Any further distribution of this work must maintain attribution to the author(s) and the title of the work, journal citation and DOI.
1. Introduction
Pressure-sensitive adhesives (PSAs) are very useful in our ordinary life, for example, a thin layer attached to the surface of tape film. Typical materials of PSA are made of block copolymers such as acrylates or styrene–isoprene–styrene (SIS) triblocks. They are usually very soft and highly dissipative, and can stick on a variety of surfaces under low pressure in short time without any solvent evaporation, heating process or chemical reactions.
A simple mechanical model was proposed by Yamaguchi et al [1] to describe viscoelasticity and cavitation during the crack propagation process in PSA. Although they successfully applied this model to probe-tack test, their model is not applicable to the final rupture process. In the present study, we extend this model to treat the rupture process, and apply it to the situation of peel tack test.
The debonding process of PSA is schematically described in the following manner (figure 1(a)):
- (a)initial state,
- (b)uniform deformation,
- (c)cavity expansion,
- (d)fibrillation.
Finally, fracture of fibrils or debonding from the probe surface occurs [2].
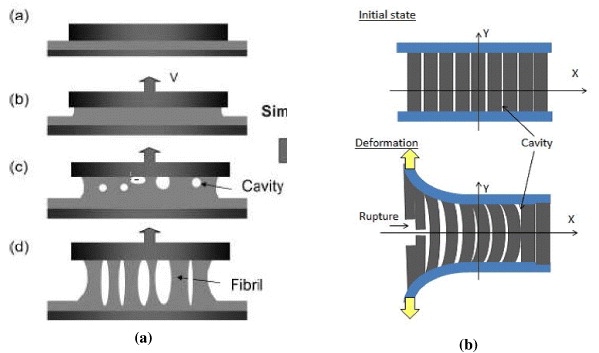
Figure 1. Schematics of (a) actual debonding process [1] and (b) corresponding model representing the peel test.
Download figure:
Standard image High-resolution image2. The block model
We consider a thin adhesive layer sandwiched between two soft tape-like substrates, and discuss the process when one side of the substrates is pulled apart with a constant speed. This process is called peel tack test. Let H0 and L0 be the initial thickness and the length of the adhesive layer. We assume that the layer is thin enough so that H0 ≪ L0 holds.
Our model has the following properties:
- (1)the adhesive layer is divided into Nblock rectangular blocks with equal size,
- (2)the flow in the film is assumed to be a superposition of slippage and parabolic deformation of the block,
- (3)cavity is modeled by a gap between adjacent blocks,
- (4)cavitation dynamics is described by the Rayleigh–Plesset equation,
- (5)when the elongation ratio exceeds a certain threshold value, this block is divided into two pieces with the same size.
Properties (1)–(4) were already taken into account in the original Yamaguchi's model, and (5) is our extension. We shall now describe the equations of motion for this block model in more detail.
2.1. Cavity expansion
The cavity volume is governed by the cavity dynamics and it is described by the Rayleigh–Plesset equation [3]

where Rj and Pcav,j are radius and pressure of the cavity in the jth block, and Pj is the pressure of the jth block, γ is the surface energy per unit area and η is the viscosity of the adhesive material.
2.2. Deformation of one block
Let us focus our attention on the jth block. Initially the block has width W0 = L0 /Nblock and height H0. When the adhesive layer is stretched by a factor λ in z-direction, the height and the width of this block are, assuming uniform deformation, changed to H = λH0 and W = W0 /λ, respectively (figure 2). Here, (X,Z) are the coordinates of the center of gravity, and Xs is the coordinate of the central position of the surface.
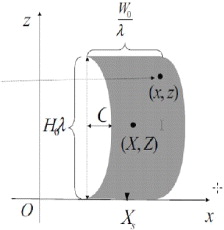
Figure 2. Coordinate system to describe the block motion and deformation. Reprinted with permission from [1].
Download figure:
Standard image High-resolution imageIn Yamaguchi's model, the block is affected by two kinds of deformation, i.e. the elongational deformation and the shear deformation. The elongational deformation is described by a parameter λ, while the shear deformation is described by another parameter C, which characterizes the parabolic deformation like the Poiseuille flow of the block. This parameter C is proportional to the curvature of the side surface of the block.
2.3. Constitutive equation
Usually, the adhesive materials have highly nonlinear viscoelasticity and have multiple relaxation times. However, for simplicity, we adopt a simple model, called the upper-convected Maxwell fluid model with a single relaxation time [4, 5]
where σij is the stress tensor, ∂vi /∂xj is the velocity gradient tensor and G is its elastic modulus.
In this case, the relaxation time is determined by the following relation:

where η is the viscosity of the PSA.
2.4. Surface tension and rupture process
On peel tack test, one side of the substrates, which are near the boundary where the external strain is imposed, deform the flat layer in initial state to the curved one in deformation state (see figure 1(b)). Using the terminology of differential geometry, radius of surface curvature of the layer is changed from infinite to finite value near the external strain imposed boundary. We assume that dissipation of energy required for the surface deformation is proportional to the curvature at that point:

The rhs of this equation expresses the curvature elasticity [6].
To describe rupture process, we introduce a condition for the rupture formation given by the following equation:

where we assume that this block ruptures into two pieces with the same size if the elongation ratio of this block λj is larger than the artificial threshold value λlimit.
After this rupture process, the lower surface of this block, which is newly created through the rupture process, shows the same motion as the free surface according to the surface tension, as was described above.
3. Simulation results
We now apply the block model for the debonding process of the adhesive layer to the rupture process. The typical parameters used here are listed in table 1. These values of the parameters are assumed in the following discussion unless explicitly stated in the text.
Table 1. Simulation parameters.
| Parameter | Unit | Value |
|---|---|---|
| PSA thickness H0 | m | 1.0 × 10⁻⁴ |
| PSA width L0 | m | 5.0 ×10⁻³ |
| Separation speed Vz | m s−1 | 1.0 ×10⁻⁵ |
| Atmospheric pressure P0 | Pa | 1.0 ×10⁵ |
| Viscosity η | Pa s | 2.0 ×10⁵ |
| Elastic modulus G | Pa | 2.0 ×10³ |
| PSA surface energy γ | J m−2 | 3.0 ×10⁻² |
| Friction coefficient μ | Pa s m−1 | 2.0 ×10⁻⁹ |
| Initial cavity radius R0 | m | 1.0 ×10⁻⁶ |
| Time step dt | sec | 1.0 ×10⁻⁴ |
| Number of blocks Nblock | 100 | |
| Elongation threshold λlimit | m | 2.0 |
Figure 3 shows the deformation behaviors of PSA and pressure distributions. For small strain ε (figure 3(a)), PSA is deformed uniformly and the pressure distribution shows as an approximately hyperbolic shape. Increasing the strain, the pressure is distributed asymmetrically (figure 3(b)) and it has the largest negative value near the boundary where the external strain is imposed (in this case, the left side). Further increasing the strain, cavities start to appear around the region where the pressure takes its largest value, and then the local negative pressure is rapidly relaxed (figure 3(c)). Finally, the rupture of PSA starts from the deformed side (figure 3(d)). Such behavior of this process is in good agreement with our ordinary experience [2, 7].

Figure 3. Simulation results of PSA profiles and pressure distributions for various strains. Using the symmetry of the model system, only the upper half of the system is shown.
Download figure:
Standard image High-resolution image3.1. Effect of cavity
To consider the effect of cavity, we compare two cases, i.e. CASE1 with a cavity and CASE2 without cavity. Figure 4 shows the stress–strain (S–S) curves for CASE1 and CASE2. We can understand that the cavity has a very important effect on the rupture process by weakening the stress of the adhesive layer.

Figure 4. The stress–strain (S–S) curves that show the effect of cavity.
Download figure:
Standard image High-resolution image3.2. Effect of thickness
Figure 5 shows S–S curves for various values of the thickness (table 2) of the adhesive layer. We observed the following properties:
- 1.the initial stage is strongly affected by the thickness of the adhesives,
- 2.the peak value of the stress decreases as the thickness of the adhesives increases,
- 3.the peak position is dependent on the film thickness.
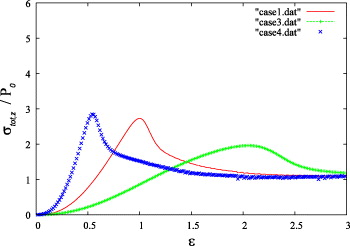
Figure 5. S–S curves for various thicknesses.
Download figure:
Standard image High-resolution imageTable 2. Used parameters for various thicknesses.
| CASE | H0 (m) | H0/L0 |
|---|---|---|
| CASE 1 | 1.0 × 10⁻⁴ | 0.02 |
| CASE 2 | 2.0 × 10⁻⁴ | 0.04 |
| CASE 3 | 5.0× 10⁻⁵ | 0.01 |
From a detailed calculation of upper convected Maxwell model (equation (2)), we get the following result:
where σs,j is shear stress at the surface of the j-the block. As the initial state is stress free (σs,j = 0 ), we then obtain

Therefore, the thinner the thickness of the adhesives H0, the larger the rate of stress increases.
3.3. Effect of separation speed
Figure 6 shows S–S curves for various values of separation speed (table 3) of the substrate. We observe that the peak value of the stress increases as the separation speed  increases.

Figure 6. S–S curves for various separation speeds.
Download figure:
Standard image High-resolution imageTable 3. Used parameters for various friction separation speeds.
| CASE |  |
|---|---|
| CASE 1 | 0.1 |
| CASE 5 | 0.5 |
| CASE 6 | 0.02 |
Higher separation rate causes larger shear stress and larger resistance for the cavity expansion, leading to a larger negative pressure. To understand this effect, the Rayleigh–Plesset equation (equation (1)) is rewritten in the following form:
Among the two terms in the parentheses on the rhs, the first term describes the dissipation phenomena and the second term expresses the surface tension. In this case, Rj is small for a long time because of the high separation speed. These two terms lead to a large negative pressure.
3.4. Effect of friction coefficient
Figure 7 shows S–S curves for various values of the friction coefficient (table 4) at the interface between adhesives layer and the substrate. The shear stress acting on the interface is proportional to the slip velocity with a coefficient μ:

Comparing equation (6) with equation (7), we understand that the stress increasing rate is proportional to the friction coefficient:


Figure 7. S–S curves for various friction coefficients.
Download figure:
Standard image High-resolution image
Table 4. Used parameters for various friction coefficients.
| CASE | μ |
|---|---|
| CASE 1 | 2.0× 10⁹ |
| CASE 7 | 2.0× 10⁸ |
| CASE 8 | 2.0× 10¹⁰ |
4. Conclusion
We extended the Yamaguchi's block model to treat rupture process. From a qualitative point of view, our results are in good agreement with the experimental data. We found that the cavities are very important in the rupture process, which weakens the stress of the adhesive layer. The thinner the thickness of the adhesives, the larger the rate of stress increases and so on.
To obtain accurate simulation results that are quantitatively comparable to experimental data, we would need more detailed modeling on the shape and the position of the cavity and the stress distribution around the cavity. Though our constitutive model is standard for a simple liquid, nonlinearity and memory effect will be important for adhesives. The constitutive model is the viscoelastic fluid one, while the commercial PSA is viscoelastic solid because it is actually weakly cross-linked. Such a property should also be taken into account by replacing our constitutive model with an appropriate one.
Acknowledgments
This work was supported by Tohoku University Global COE program 'Weaving Science Web beyond Particle-Matter Hierarchy' and by Grant-in-Aid for the Scientific Research from the Ministry of Education, Culture, Sports, Science and Technology, Japan.