
Abstract
Carbon-supported Pt catalysts in nano-size for proton exchange membrane fuel cell (PEMFC) were synthesized by electroless deposition method with and without using ethylene glycol (EG) and NaBH4 as reductant. Scanning electron microscopy (SEM), energy dispersive x-ray spectroscopy (EDS), and transmission electron microscopy (TEM) methods were used to determine the content, size and the distribution of Pt particles on carbon Vulcan XC-72. The cyclic voltammetry (CV) measurements were used to evaluate the activity and durability of catalyst. A comparison of physical and electrochemical characterizations was carried out on three types of catalysts: Pt catalyst of 20 wt% on Vulcan XC-72 prepared by electroless deposition method with and without EG and commercial catalyst purchased from Fuel Cell Earth LLC (USA). The results showed that with the presence of EG, the size of synthesized Pt particles was around 2–3 nm, in comparison with 4–16 nm in the case without EG and 3–4 nm of commercial catalyst. The CV results expressed that catalysts prepared with EG have the highest activity and durability.
Export citation and abstract BibTeX RIS

Content from this work may be used under the terms of the Creative Commons Attribution 3.0 licence. Any further distribution of this work must maintain attribution to the author(s) and the title of the work, journal citation and DOI.
1. Introduction
Proton exchange membrane fuel cells (PEMFCs) are considered as a promising alternative power source because of their advantages including fast startup, high energy efficiency, low temperature and being environmentally friendly [1–4]. The ideal catalyst material for the electrochemical reaction in the PEMFC is platinum and platinum alloys. However, Pt is a precious and expensive metal which leads to that the use of catalytic materials will increase the cost of PEMFCs tremendously. This is one of the main obstacles besides durability factors limiting the ability of broad commercialization of PEMFCs in the world. To increase the competitiveness of the PEMFC against other renewable energy sources, study in order to reduce the amount used of Pt while ensuring the quality and durability of PEMFCs is essential. Developing nanotechnology opens up the solution of this problem. Pt catalyst particles in size <10 nm are manufactured and dispersed on spherical carbon particles with diameter of a few tens of nanometer. This contributes to the increase in surface area of the catalyst significantly and increases the catalytic activity [5–9]. Some studies focus on replacing Pt with less expensive materials such as Pd, Ru, Mo, in order to reduce costs and improve some properties of PEMFCs [1, 3, 10–12].
In the last two decades, many studies on preparation of catalysts for PEMFCs have been carried out. These studies showed that the surface area and catalytic activity of Pt/C depend strongly on the preparation method. For the preparation of Pt catalysts on carbon supports, there are several commonly used methods including: chemical precipitation, the polyol process, electroplating, sputtering techniques, emulsions and Pechini [6]. Recently, the electroless deposition method using EG has gained the attention of researchers due to several advantages: simple devices, no need to use organic stabilizers, complex heat treatment process, small Pt catalyst particle size and uniform distribution [13–16]. In this report the catalytic material Pt/C (20 wt%) is prepared by electroless deposition with reductant NaBH4 using a combination of ethylene glycol (EG). The activity and durability of catalysts are also evaluated and compared with commercial catalyst purchased from Fuel Cell Earth LLC (USA).
2. Experimetal method
2.1. Synthesis of catalysts Pt/C by electroless deposition method
Vulcan XC-72 carbon with particle size ∼40 nm serving as support was purchased from Fuel Cell Earth Co. (USA). All the chemicals were of analytical grade. Chloroplatinic acid hexahydrate (H2PtCl6·6H2O), sodium borohydride (NaBH4), ethylene glycol (EG), potassium hydroxide (KOH), hydrochloric acid (HCl) (all from Merck) were used.
Pt/C catalysts particles were synthesized by the following route: at first Vulcan XC-72 carbon supports were pre-treated by heating at 773 K for 2 h. Afterward, the carbon supports were filled, washed with a huge amount of deionized (DI) water, and then dried for one hour at 337 K. In the next stage, the carbon supports were dispersed into the solvent (DI water with and without EG). The precursor H2PtCl6·6H2O in concentration 10 g l−1 was poured with an amount calculated to get the content of Pt to be 20 wt% on the supports. After mixing, the mixture was ultrasonicated for 1 h. An excess amount of reduction agent NaBH4 0.01 M was added and then this mixture was heated to 80 °C at 4 h. Finally, the synthesized catalyst particles Pt/C were filled, washed by DI water, and dried for 12 h at 120 °C [14, 17–19].
2.2. Physical characterizations of nanocatalyst
Chemical composition analysis of catalysts was performed by EDS method with a JED 2300 analyzer associated with a scanning electron microscope (SEM). The size of the Pt catalyst particles and the carbon supports was estimated by transmission electron microscopy (TEM). The TEM pictures of the Pt/C catalyst were captured by the JEM 1010 apparatus made by JEOL Corporation (Japan) with different magnifications at National Institute of Hygiene and Epidemiology. The sizes of the 100 Pt catalyst particles were measured directly on the TEM pictures in order to determine the distribution and mean diameter of the synthesized catalyst particles.
2.3. Electrochemical characterizations
The catalyst ink was prepared by ultrasonication dispersing 6 mg of Pt/C 20 wt% in 6.2 ml H2O; 2.0 ml isopropyl alcohol; 16.2 μl nafion 10% solution. After 1 h, a homogeneous solution ink was obtained.
The sample used in electrochemical measurements was a high-density carbon disc having a diameter of 15 mm. The sample surface was ground up to 2000 grid paper and then finished by chromium particles. Afterward, the sample was cleaned by ultrasonication in water and alcohol for 10 min. The catalyst layer was prepared by pipetting the catalyst ink on the sample surface. After reaching the Pt loading, the sample was dried in atmosphere at room temperature.
The cyclic voltammetry (CV) measurement was the most popular method to evaluate the activity and the durability of the catalyst Pt/C. The sample was placed into a teflon holder with a controlled working area of approximately 1 cm2. A three-electrodes cell was used in which the counter electrode was platinum and the reference electrode was saturated calomel. In the CV measurements, the potential values were converted automatically to normal hydrogen electrode (NHE). The CV curves were conducted in H2SO4 0.5 M solution and measured by the potentiostast PARSTAT2273 (EG&G —USA).
2.3.1. Activity of catalyst.
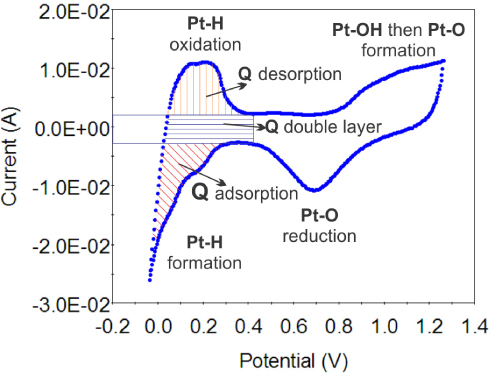
To investigate the catalyst's activity, the CV measurements were swept in the potential range from 0 to 1.3 V (NHE) with scan rate 50 mV s–1 at ambient temperature. Figure 1 is a typical CV curve of Pt/C catalyst in H2SO4 0.5 M solution. From the CV curve, it was easy to calculate the charge of the electrochemical processes which occur on the catalyst particles by integrating. As a result, the electrochemical surface area (ESA) showing the activity of the catalyst was estimated by the following formula [20–24]:
where QH is the average charge integrated from the voltammogram of the adsorbtion/desorbtion hydrogen process on the CV curve (mC), constant 0.21 shows the charge in theoretical calculation to oxidate a single hydrogen layer adsorbed on bright platinum (mC), mPt is the platinum loading on the surface sample (g cm−2).
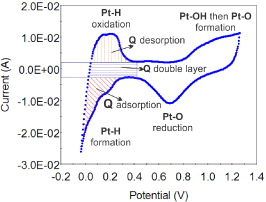
Figure 1. A typical CV curve of Pt/C catalyst in H2SO4 0.5 M solution.
Download figure:
Standard image High-resolution image2.3.2. Durability of catalyst.
To examine the durability of the catalyst Pt/C, the CV characteristic of the sample was measured in the potential range 0.5–1.2 V (NHE) with 1000 cycles and scan rate 100 mV s−1. In this potential range, Pt would be dissolved becoming ions in the forward scan. Therefore, the Pt loading in the sample would be reduced leading to the decrease of ESA value. In addition, in the reverse scan, Pt ion would be sintered so that the size of Pt catalyst particles increases, which would also lead to the decrease of ESA value of the catalyst. Prior to each CV measurement, the sample was polarized at the start potential value for 60 s.
3. Results and discussion
3.1. TEM and EDS characterizations
The content of Pt in the catalysts is determined by energy dispersive x-ray spectroscopy (EDS) analysis. Figure 2 shows the EDS result of the commercial catalyst which indicates that the content of Pt in this catalyst is approximately 19.86%. Besides the two main elements C and Pt, there is a little amount of oxygen in the catalyst. Appearance of oxygen may be caused by contaminants during EDS analysis preparation. The contents of Pt in three catalysts are shown in table 1.
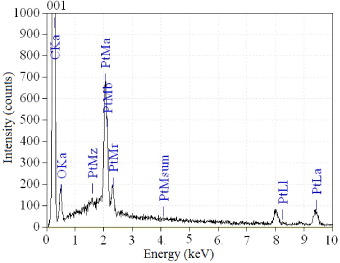
Figure 2. EDS analysis result for Pt/C commercial catalysts.
Download figure:
Standard image High-resolution imageTable 1. The content of Pt (wt%) in three types of catalysts analysis by EDS.
| Sample | Commercial | Without EG | With EG |
|---|---|---|---|
| Pt/C (wt%) | 19.86 | 18.85 | 20.97 |
Figure 3 is a TEM image of the commercial catalyst with Pt grains in black and carbon support in gray. It shows that the Pt particles have very small diameter spread homogeneously on spherical carbon grains. The histograms of the particle sizes show that the particle sizes range from 2 to 6 nm for Pt and concentrated in a range 3–4 nm.
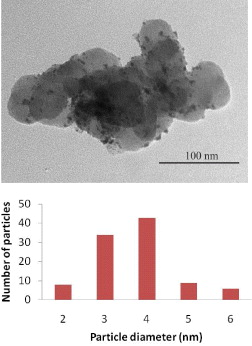
Figure 3. TEM picture with magnification ×80.000 and histogram of particle size distribution for the Pt/C commercial catalyst.
Download figure:
Standard image High-resolution imageFor the sample catalyst synthesized without supported EG, the TEM image is shown in figure 4. The TEM image also proves that the distribution in size is absolutely heterogeneous. The catalyst particles trends to become bigger due to agglomerate. The synthesized catalyst particles have big size, changing in a large range 4–16 nm. In contrast, when EG is used, the size of the synthesized Pt particles is reduced significantly in the range 1–4 nm and concentrated in the range 2–3 nm (figure 5). The distribution of Pt particles on the carbon powder is uniform. From this it may be interpreted that EG plays a role like an immediate bridge between carbon supports and precursors PtCl62− and the capacity of adsorption of PtCl62− precursors on carbon supports increases. As a result, the distribution of Pt particles is more uniform and the size of catalyst is reduced after the reduction process by NaBH4. Therefore, the catalyst properties are improved considerably when EG is used.

Figure 4. TEM picture with magnification ×80.000 and histogram of particle size distribution for the Pt/C synthesized without EG.
Download figure:
Standard image High-resolution image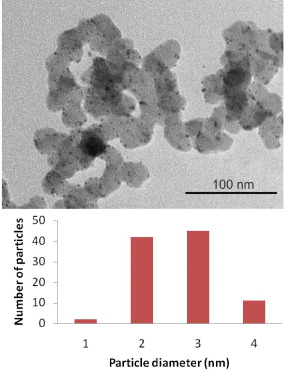
Figure 5. TEM picture with magnification ×80.000 and histogram of particle size distribution for the Pt/C synthesized with EG.
Download figure:
Standard image High-resolution image3.2. Evaluation of catalytic activity
The distribution and difference in the size of the catalyst particles strongly influence the activity of the Pt/C catalysts. As mentioned above, the electrochemical surface area (ESA) reflects the intrinsic electrocatalytic activity of a catalyst and its values can be calculated from the CV curve by integrating. Therefore, the CV method is used to evaluate this property. Figure 6 shows CV curves in H2SO4 0.5 M solution with scan rate 50 mV s−1 of the catalyst samples synthesized with and without EG in comparison with a commercial catalyst. On the CV curves, there are the electrochemical peaks corresponding to the different electrochemical reactions on the samples' surface. In the potential range 0–0.4 V, the peaks express the adsorb/desorb processes of hydrogen on Pt crystal. The mechanism of these processes may take place by two stages. In the forward scan, the potential range from 0.4 to 0.8 V corresponds to the charge of the double layer by the oxygenated groups on the carbon support surface. At the potential 0.85 V, the oxidation process of Pt metal happens to form Pt oxides. Corresponding with this process, there is a reduction peak at 0.7 V of reduction process of Pt–O in the reverse scan [3, 20, 22]. Among the peaks of the catalyst samples, those without EG are the smallest. This means that the activity of these samples is relatively low. In comparison with the commercial sample, the activity of the catalyst synthesized with EG might be the highest.

Figure 6. CV curves of catalyst samples in H2SO4 0.5 M solution: commercial, synthesized without EG, and synthesized with EG; scan rate 50 mV s−1.
Download figure:
Standard image High-resolution imageThe calculated ESA values of the catalyst samples are shown in table 2. The difference in ESA value may be due to the difference in the size of Pt particles. With the biggest size of particles, the ESA value of the sample without EG is the lowest. However, although possessing the smallest size, the ESA value of the synthesized sample with EG is significantly higher than the ESA value of the commercial sample. Thus, the catalysts with smaller particle size give a higher activity due to larger surface area.
Table 2. ESA values of three catalysts integrated from CV curves.
| Sample | Commercial | Without EG | With EG |
|---|---|---|---|
| ESA (m2 g−1) | 52.31 | 20.63 | 54.67 |
3.3. Evaluation of catalytic durability
Evaluating the durability of the Pt/C catalysts is based on declining of the ESA values after testing 1000 CV cycles. After each 200 cycles test, the sample activity is evaluated in order to observe the changes of ESA values of the catalyst. Figure 7 shows the CV curves to evaluate the activity of the catalyst sample synthesized with EG before and after the durability test. After each 200 cycles, the size of the peaks on the CV curve decreases significantly, leading to the decrease of the ESA value of the sample, and the activity of the catalyst is decreased considerably. There are two processes during the test which effect the decrease of the durability of the catalyst Pt/C. At first, the Pt particles are dissolved to the ions according to the following equations:


This process happens to directly affect the Pt catalysts' loading [8, 12, 25]. In addition, the durability is affected by the second process which is the corrosion of carbon material. In PEMFC, the carbon supports are corroded according to the following equations:


The resulting reaction

is taken place at the potential 1.2 V.
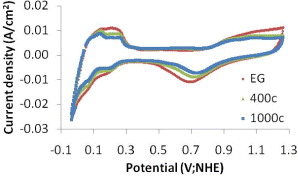
Figure 7. The CV curve to evaluate the durability for Pt/C synthesized with EG; scan rate 50 mV s−1.
Download figure:
Standard image High-resolution imageCorrosion of the carbon supports leads to the fall of Pt particles. Furthermore, corrosion of carbon supports also causes the poisoning phenomena of the catalyst on forming CO product [3, 24, 25].
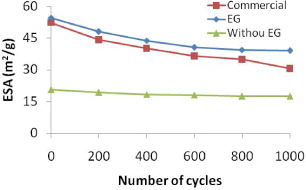
Figure 8 shows the decrease of the ESA values of the catalyst samples after durability tests. After testing, the ESA values of all catalyst samples decrease. The ESA value of the commercial catalyst decreases the most. After 1000 cycles, the ESA values of the commercial catalyst decrease approximately 41.38%, while the ESA value of the catalyst synthesized with EG decreases around 28.3%. The synthesized catalyst without EG just has a decreased ESA value of 15%. As this catalyst has the biggest size, consequently it has the highest durability although the lowest activity. The catalyst synthesized with EG has high activity and durability.
Figure 8. The change of ESA value of catalyst samples after CV durability tests.
Download figure:
Standard image High-resolution image
4. Conclusion
Pt/C catalyst of 20 wt% has been successfully synthesized by electroless deposition method using NaBH4 as reductant. The TEM images show that with the presence of ethylene glycol (EG), the Pt catalyst particles are distributed uniformly on the carbon supports and have size the in range 2–3 nm. In comparison with the commercial catalyst produced in the USA, the CV measurements demonstrate that the ESA value of synthesized catalyst with EG is higher than that of commercial catalyst, and the decrease of the ESA values of synthesized catalyst is smaller than that of commercial catalyst after 1000 durability test cycles. The catalyst synthesized with EG exhibits superior activity and durability over commercial catalyst and promises to be a potential material for PEMFCs.
Acknowledgments
This paper was completed with the financial assistance of the Vietnam Academy of Science and Technology and the help of the Institute of Materials Science.