
Abstract
In this work nanostructured  -MnO2/C composite electrode was synthesized via the reduction reaction of potassium permanganate. A wide range of carbons such as mesoporous carbon (MC), graphite (GC), super P carbon (super P) and Vulcan carbon (VC) were used in order to enhance the interfacial electrical conductivity and the electrochemical capacitance of the composite electrodes. Physical properties, structure and specific surface area of electrode materials were investigated by scanning electron microscopy (SEM), x-ray diffraction and nitrogen adsorption measurements. The capacitance behavior of MnO2/C materials was studied in aqueous and non-aqueous solution using cyclic voltammetry, galvanostatic charge/discharge and impedance spectroscopy measurements. The composite electrode exhibits the highest capacitance at 30 wt% activated carbon. Among different carbons used, the maximum capacitance of MnO2/super P electrode is as high as 205 F g−1 at 50 mV s−1 and retains 98% after 300 cycles.
Export citation and abstract BibTeX RIS

Original content from this work may be used under the terms of the Creative Commons Attribution 3.0 licence. Any further distribution of this work must maintain attribution to the author(s) and the title of the work, journal citation and DOI.
1. Introduction
In recent years, supercapacitor, also called electrochemical capacitor (EC) or ultracapacitor, has been a promising auxiliary energy storage device along with primary power sources such as batteries or fuel cells for the purpose of power enhancement in short pulse application. According to different energy storage mechanisms, supercapacitor can be divided into three categories: the electric double-layer capacitor is linked to charging of double layer at electrode–electrolyte interface [1], the redox supercapacitor utilizes the redox reaction, and asymmetric capacitor which is based on Faradaic reaction in addition to double-layer charge [2, 3]. Materials mostly used for supercapacitors include carbon materials, conducting polymers, and transitions metal oxides. However, each material has its own advantages and disadvantages [4]: porous carbon materials have long life cycle and good mechanical properties, but low specific capacitance [5]; conducting polymers are highly flexible but have poor cyclability [6]. Among the transition-metal oxides, manganese oxides have been strongly investigated because of their important industrial applications, such as catalysis and energy storage. Over the years, various different shapes of nanostructured manganese oxides such as nanowires, nanotubes, nanoflowers, nanoflakes have been synthesized in an attempt to increase the specific capacitance of materials closer to the theoretical value of 1100 F g−1 [7, 8]. For application in electrochemical reactions as supercapacitors [9] which involve solid-state diffusion processes, nanoparticles are advantageous as they provide diffusion path length more than corresponding materials of large particles. So, in order to improve the electrochemical performance of manganese oxides, a nanostructured composite electrode or hierarchical porous structure with high electronic conductivity must be considered. The porous architecture could be carbon nanofoams, template mesoporous carbon, graphite and carbon nanotube assemblies. In such a hybrid electrode configuration, carbon substrates act as highly conductive current collectors, while the interconnected porosity serves as a continuous pathway for electrolyte diffusion, and the nanoscopic active MnO2 phase shortens solid-state transport distances for ions into the oxide materials [10–12]. Recent efforts to integrate carbon and MnO2 have primarily focused on depositing nanoscale MnO2 onto carbon nanotubes by using a variety of approaches, including physical mixing of the components [13, 14], chemical deposition using precursors such as permanganate [15–17], thermal decomposition [18] and electrochemical deposition [13, 19].
In this work manganese dioxide (MnO2) is chosen for development of the wanted pseudocapacitane and combined with different carbon frameworks such as mesoporous carbon (MC), graphite (GC), super P carbon (super P) and vulcan carbon (VC). MnO2 nanoparticles are incorporated into micro and meso-carbon structures, by successfully growing them on the porous carbon surface through redox reaction between potassium permanganate (KMnO4) and manganese sulfate (MnSO4) in aqueous solution containing carbon matrix. By this way, manganese oxide was highly dispersed on the carbon matrices, leading to a more electrochemically active electrode surface. Indeed, the specific capacitance of composite electrode significantly increased to compare with the pure MnO2 electrode. The electrochemical properties of the electrode materials were examined in both non-aqueous and aqueous electrolyte solution.
2. Experimental
Analytical grade reagents KMnO4 (Merck), MnSO4.H2O (Sigma Aldrich), NaCl (Merck), tetrabutylammonium perchlorate (TBAP, Sigma Aldrich), acetonitrile (ACN, Merck), polytetrafluoro ethylene emulsion (PTFE, 60 wt% in water, Sigma Aldrich), mesoporous carbon (Sigma Aldrich), vulcan carbon—XC72R (Cabot), super P carbon (Timcal), graphite carbon (PINACO company, VietNam) were used as purchased. Pure chemical manganese dioxide (CMD) was synthesized by the chemical reduction between KMnO4 and MnSO4. For MnO2/C materials, carbon powder was first added into deionized water and was kept stirring for 20 min to obtain a homogenous suspension. Then, KMnO4 and MnSO4 with a mole ratio of 3:2 were continuously added into the suspension and the mixture was stirred for 1 h at 80 °C. The product was finally rinsed many times with distilled water and was dried at 120 °C in 48 h.
Samples were analyzed by powder x-ray diffraction (XRD) using a PANalyticalX'Pert MPD diffractometer with Cu-Kα radiation, 0.05° step and 8 s/step counting time to minimize noise. The morphology and the distribution of grain size were determined using a field emission scanning electron microscopy (FE-SEM) ZEISS ULTRA 55 instrument equipped with energy dispersive x-ray (EDX) spectroscopy analysis. Brunauer–Emmett–Teller (BET) surface area measurement in N2 atmosphere was carried out using AUTOSORB-1C surface area analyzer.
For electrochemical characterization, the electrodes were prepared on high-purity carbon substrates which were firstly polished and rinsed many times with acetone, then dried and weighed. Composite electrodes were prepared by mixing 65 wt% of MnO2 (or MnO2/C composite), 30 wt% super P and were prepared from intimate mixtures of synthesized MnO2 (or MnO2/C) with super P as additional conductor and 5 wt% polytetrafluoro ethylene (PTFE, 60 wt% in water, Sigma Aldrich). The resulting slurry was coated on a 1 cm2 carbon substrate, and then dried at room temperature for 48 h and then at 120 °C in air for 1 h. The typical active material loading was 15 mg cm−2. A glass cell includes three electrodes: MnO2/C working electrode, Pt auxiliary electrode, and reference electrode (Ag/AgCl for aqueous solution and Ag/Ag+ TBAP (0.1 M) in ACN for organic solution). The solution of 2 M NaCl and 0.5 M TBAP/ACN was used as an electrolyte. The cyclic voltammetry (CV) studies were carried out using a MetrOhm Autolab FRA/PGSTAT302N in the potential range of 0.0–1.0 V (for aqueous solution) and −1.0–1.0 V (for non-aqueous solution) at a scan rate range from 10 to 100 mV s−1. The specific capacitance (Csp) was calculated from the area of the CV's charge and discharge curve using the formula
where I is the current density, m is masse of the active electrode and ΔV/Δt is scan rate.
Electrochemical impedance spectroscopy (EIS) was performed using the same cell set-up as described above by applying a small perturbation voltage of 10 mV in the frequency range of 100 kHz to 0.1 Hz. The analysis of impedance spectra was performed by equivalent circuit software provided by NOVA 1.9 (MetrOhm Autolab FRA/PGSTAT302N).
3. Results and discussion
3.1. Synthesis and physicochemical characterization
Powder XRD patterns of MnO2 and MnO2/C composite materials after drying at 120 °C are shown in figures 1 and 2. Without carbon addition we obtain the principal phase of epsilon manganese dioxide (-MnO2, akhtenkite, ICSD-076430) with the minor amount of alpha manganese dioxide. The diffraction of peaks in figure 1 at value 2θ of 37.2°, 42.7°, 58°, 78°, 90° were defined by structure of ε-MnO2. The occurence of minor phase is also detailed in figure 1. It is well-known that MnO2 exists in several crystallographic structures: α, β, γ, or δ-forms depending on the way a [MnO6] octahedral interlinks with another [20–24]. The polymorphism of MnO2 can be controlled by the synthesis method and synthesis conditions (reagents, temperature, potential, alkali or alkaline metal-ion etc) [25, 26]. Because the capacitance properties are due to intercalation/de-intercalation of protons or cations in MnO2, only some crystallographic structures with sufficient gap to accommodate these ions are expected to be useful for capacitance studies. Devarai et al [26] have reported the specific capacitance measured for MnO2 decrease in the following order α ≈ δ > γ > λ > β.
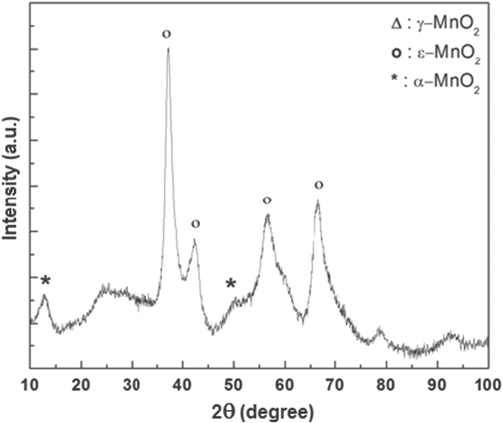
Figure 1. XRD patterns of MnO2 prepared from chemical reduction of KMnO4 and MnSO4 at low temperature.
Download figure:
Standard image High-resolution image
Figure 2. XRD patterns of MnO2/C composite electrodes at (a) 20 wt% C ratio; (b) 50 wt% C ratio.
Download figure:
Standard image High-resolution imageBy adding carbon, the carbon material acts not only as a highly conductive agent but also as a template for growing and dispersing MnO2. Indeed, the structure of composite electrode is usually porous with high surface area and electronically conducting structure, which can provide good electrochemical capacitance with the high mass-loading of MnO2 phase. The variation of carbon ratio or carbon types is expected to affect the structure, morphology as well as electrochemical properties of the MnO2/C composite electrodes.
The addition of carbon changed the crystalline structure of MnO2, as the carbon ratio is about 30 wt%, the MnO2 phase is purely -MnO2 without the occurrence of second phase (other polymorphisms of MnO2). However, when carbon content is higher than 30 wt%, the second phase appeared and was identified as γ-MnO2 (orthorhombic unit cell, P62/nma). All reflections show additional shoulders; the details are shown in figure 2.
By changing the carbon types, at 30 wt% C, the crystalline structure was also affected. As shown in figure 3, super P carbon gives the formation of single phase -MnO2 while Vulcan and mesoporous carbon lead to the mixture phases of /γ-MnO2. In fact, the influence of carbon on the structure and composition of MnO2 phase is also known, as reported early in the case of CNTs, graphene, hard carbon etc. Moreover, some carbons can act not only as the substrate for nucleation of MnO2 deposit but also as reducing agent, such as CNTs and graphene [8].
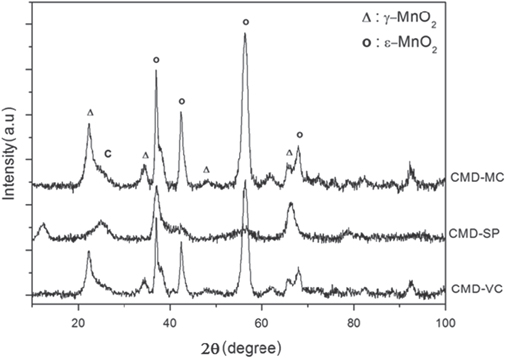
Figure 3. XRD patterns of MnO2/C composite electrodes prepared with different types of carbon: (a) MnO2/mesoporous C; (b) MnO2/Vulcan C; (c) MnO2/super P carbon.
Download figure:
Standard image High-resolution imageThe surface morphology of MnO2 and MnO2/C composite electrode were studied by scanning electron microscopy (SEM) and are shown in figure 4. MnO2 prepared from a chemical reduction at low temperature exhibits high mono-dispersed flower-like nanostructure. Similar morphologies were also observed when using KMnO4 and formamide acid or NaMnO4 in acidic aqueous medium at room temperature or low temperature (40 °C, 60 °C) [27, 28]. The carbon addition affects MnO2 morphology at different carbon ratios can also be observed. At 25–50 wt% graphite carbon, MnO2/C composite materials show the heterogeneous particle shapes such as aggregates of spherical particles or plate-like particles with particle size in 40–70 nm range. At carbon ratio less than 25 wt%, a homogenous spherical particle was obtained. A similar phenomenon was observed by using different carbon templates at fixed C ratio of 30 wt% (figure 5). With graphite, vulcan or mesoporous carbon, materials exhibited highly heterogeneous particle shapes. In contrast, the good homogenous of fine spherical particles was obtained with super P carbon.
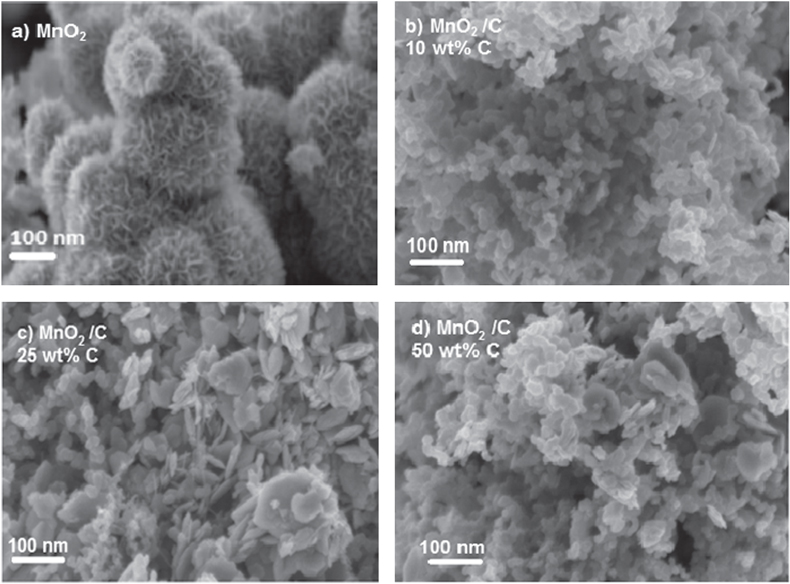
Figure 4. SEM image of MnO2 (a), MnO2/C composite electrodes at different C ratios: (b) 10 wt% C, (c) 25 wt% C, (d) 50 wt% C.
Download figure:
Standard image High-resolution image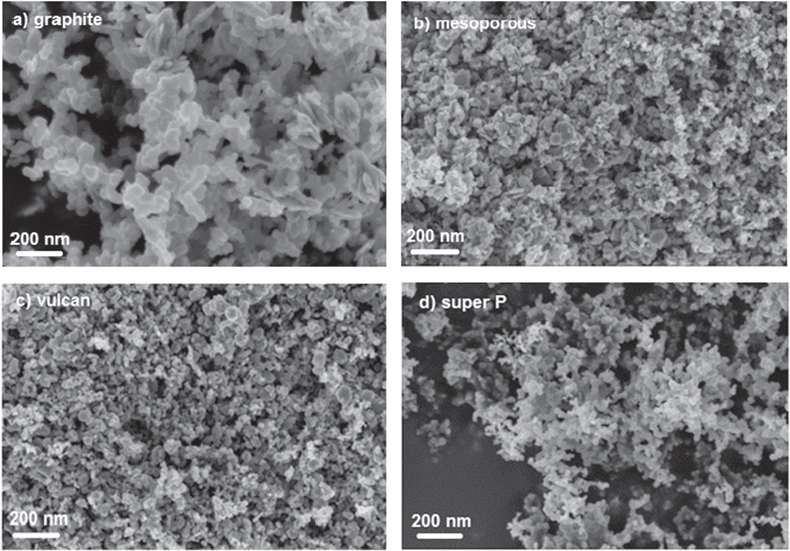
Figure 5. SEM image of MnO2/C composite electrodes with different type of carbon at 30 wt%: (a) graphite carbon, (b) mesoporous carbon, (c) vulcan carbon, (d) super P carbon.
Download figure:
Standard image High-resolution image3.2. Electrochemical characterization
The charge storage mechanism of MnO2 is based on two processes: intercalation/de-intercalation and surface process. The energy conversion and storage capability of MnO2 mainly come from its ability to give fast and reversible redox reaction between Mn (III) and Mn (IV) with the intercalation of proton or alkali metal cations such as Na+, K+, or Li+ in the bulk upon reduction followed by de-intercalation upon oxidation [22, 28]. The surface Faradaic reaction involves the adsorption of electrolyte cations (C+ = H+, Li+, Na+ and K+) on manganese oxide [29, 30]. The contribution of each type of charge storage mechanism depends on crystal structure, water content, surface area, porosity and intercalated cations. The pseudocapacitive properties of nanostructured MnO2 and MnO2/C were studied in 2 M NaCl solution and in 0.5 M TBAP/ACN. Cyclic voltammograms were recorded at scan rate of 50 mV s−1 for all samples. In figure 6 CV curve of graphite exhibited highly symmetric and distinct rectangular shape. This is due to the reversible adsorption of ions of electrolyte onto the active material that are electrochemically stable and have high accessible specific surface area (SSA). The capacitance of C graphite is described as double layer capacitance and the value depends on the electrolyte used. The specific capacitance (Csp) achieved with aqueous alkaline or acid solution is generally higher than in organic electrolyte [31].

Figure 6. CV curves of carbon graphite, MnO2, MnO2/C composite electrodes recorded between 0 and 1 versus Ag/AgCl at scan rate of 50 mV s−1.
Download figure:
Standard image High-resolution imageIn addition to the existence of double-layer capacitance, MnO2 has pseudocapacitance due to Mn4+/Mn3+ reversible redox reaction. Indeed, the CV curve deviated from the rectangular shape due to slow diffusion within material particle on the surface and into the bulk. Conducting graphite carbon is added to active materials with the aim to improve the conductivity as well as stabilize the composite electrode structure. The effect of carbon clearly exhibits on the shape of CV scan. It becomes symmetric rectangular shape but opens wider than the curves of C graphite and MnO2. The result can be explained by the fast, reversible surface redox reaction of MnO2 due to enhancement of conductivity and shortened diffusion pathway by using high porosity and high SSA of carbon material.
The composite effect is demonstrated by the capacitance values measured for composite electrodes in aqueous and organic solution. MnO2/C electrodes at different C wt% exhibit expectedly higher capacitance values than both pure MnO2 and carbon. This means Csp of electrode composites is contributed by two mechanisms of charge storage: double-layer capacitance and reversible redox reaction at the surface/in the bulk of active material. In figures 7 and 8, as the scan rate increases, Csp value decreases due to the diminution of double-layered capacitance. In 2 M NaCl solution, Csp is generally 1.5 times larger than in TBAP/acetonitrile at low carbon ratio. Because the diameter of solvated TBA+ and ClO4 − in acetonitrile is larger than that of Na+ and Cl− in water (table 1). In fact, the difference in the size of solvated ions and permeability of electrolytic solution affect the properties of the double layer capacitance of electrode composite [32]. At 30 wt% C graphite in the composition of MnO2/C, the capacitance is the largest among the prepared electrode series. We have not reached any definitive explanation for this specific value at 30 wt% C. However, this clearly sets the limit between two composition domains where performance relies on two distinct electrochemical behaviors: below 30 wt% C the higher MnO2 loading within a porous structure, the higher the resulting electrode capacitance. Above 30 wt% C, the lower capacitance was observed (figure 9). In this composition, the materials showed good electrochemical efficiency in terms of active surface area and good homogenous combination of carbon porous and MnO2 particles.

Figure 7. Specific capacitance of MnO2/C composite electrodes with different carbon ratios at different scan rates in 2 M NaCl.
Download figure:
Standard image High-resolution image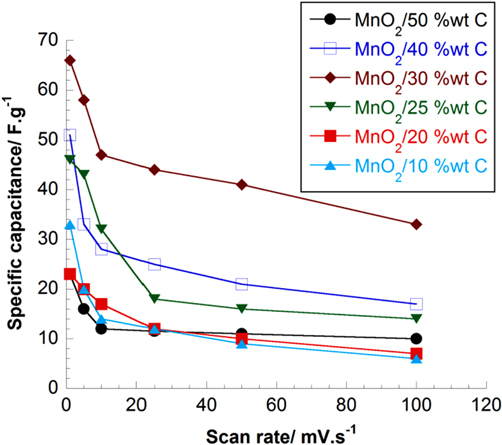
Figure 8. CV curves of MnO2/C composite electrodes with different carbon ratios at different scan rates in 0.5 M TBAP/ACN.
Download figure:
Standard image High-resolution imageTable 1. Comparison of specific capacitance values MnO2/C graphite composite electrodes with different carbon ratios measured at scan rate of 50 mV s−1 in different electrolyte solutions.
| wt% C | Specific capacitance (F g−1) | |
|---|---|---|
| 0.5 M TBAP | 2 M NaCl | |
| 0 | 20 | 35 |
| 10 | 9 | 36 |
| 20 | 10 | 14 |
| 30 | 41 | 67 |
| 40 | 21 | 18 |
| 50 | 11 | 16 |
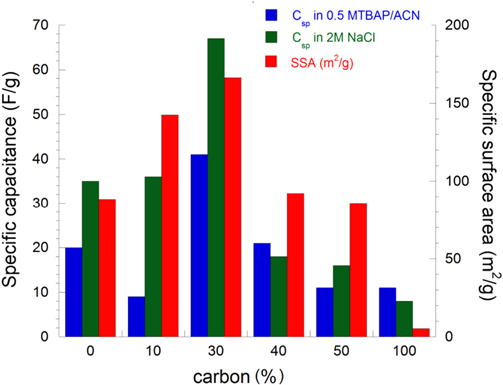
Figure 9. Relation between specific capacitance and specific surface area of MnO2/C composite at different carbon ratios measured in aqueous and non-aqueous electrolyte solutions.
Download figure:
Standard image High-resolution imageAbove 30 wt% C, the capacitances tend to decrease in the resulting composite electrode. It seems that the double-layer capacitance dominated at the high carbon ratios while the pseudo-capacitance was particularly obtained at low carbon ratio. The effect of different carbon contents to the electrochemical capacitance can be also observed from the shape of voltammograms (figure 10). The CV curves becomes more and more symmetrically rectangular at high wt% C. In addition, the high C ratio conducted on the surface results in less porous compared to low C ratio due to the presence of particle agglomerations and also the several particle morphologies (figure 4). Lei et al [33] have reported the same behavior of mesoporous carbon-manganese oxide composite in changing wt% MnO2 loaded on templated carbon.
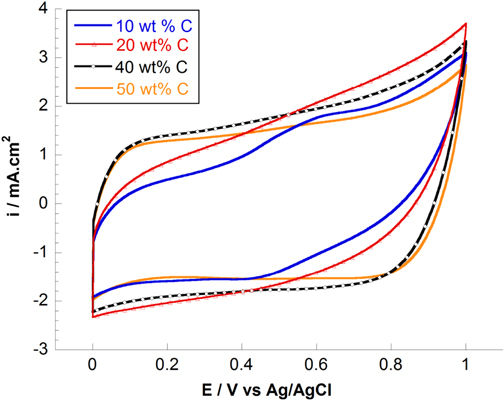
Figure 10. CV curves of MnO2/C composite electrodes with different carbon ratios at 50 mV s−1 in 2 M NaCl solution.
Download figure:
Standard image High-resolution imageThe capacitance retention of MnO2/C with 30 wt% C was studied in two different electrolyte solutions (figure 11). The electrode cycling does not however affect electrochemical performances the same way depending on electrolyte solution. In aqueous 2 M NaCl, the loss is 12% after 300 cycles while the loss is 16% in acetonitrile based electrolyte. The capacitance stabilizes quicker in aqueous than in non-aqueous solution due to low viscosity and good conductivity.
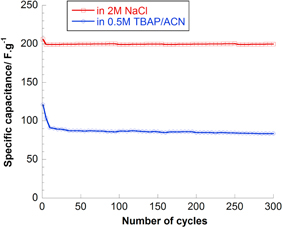
Figure 11. Specific capacitance upon cycling for MnO2/30 wt% carbon graphite in aqueous and non-aqueous electrolyte solution.
Download figure:
Standard image High-resolution imageAt the same C ratio, the changing of carbon types affects Csp in different electrolyte solutions (figures 12 and 13). The highest Csp was obtained for MnO2/C electrode composite using Super P carbon, 121 F g−1 in TBAP/ACN and 206 F g−1 in 2 M NaCl. Different electrochemical behaviors can be explained by the specific surface area values measured for resulting composite electrodes. The highest SSA is the highest Csp obtains (figure 14). To explain these results, the capacitive behaviors of different carbons were evaluated by cyclic voltammetry in NaCl solution (figure 15). The calculated Csp are 12 F g−1 (C graphite), 18 F g−1 (C meso), 22 F g−1 (C vulcan) and 28 F g−1 (C super P). In addition, graphite carbon was characterized normally by micro-sized particle and high crystal structure displays very low surface area of 5.2 m2 g−1 while C mesoporous, super P or vulcan carbon displays larger surface area (>50 m2 g−1) due to the aggregation of nano-sized primary particles. As seen in SEM images (figure 5), we can conclude that used templated carbon has influenced the microstructure of electrode (particle size and morphology). The fine nano-sized particles with porous structure were achieved in case of super P carbon while the other carbons showed the particles agglomeration as well as low porous surface.
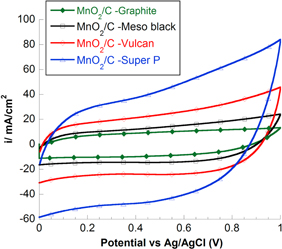
Figure 12. CV curves of MnO2/30 wt% C with different carbon types at scan rate of 50 mV s−1 in 2 M NaCl.
Download figure:
Standard image High-resolution image
Figure 13. Specific capacitance of MnO2/30 wt% C with different carbon types at scan rate of 50 mV s−1 in 0.5 M TBAP/ACN.
Download figure:
Standard image High-resolution image
Figure 14. Relation between Csp and SSA of MnO2/30 wt% C with different carbon ratios measured at 50 mV s−1 in aqueous and non-aqueous electrolyte solution.
Download figure:
Standard image High-resolution image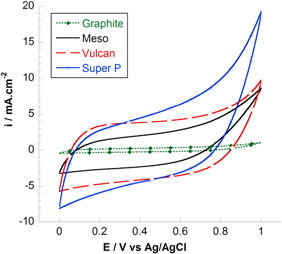
Figure 15. CV curves of different carbons measured at 50 mV s−1 in aqueous NaCl solution.
Download figure:
Standard image High-resolution imageElectrochemical impedance spectroscopy (EIS) measurements were also carried in the frequency range of 100 kHz–0.1 Hz at opening circuit potential with an ac perturbation of 10 mV (figure 16). We observed an evolution of impedance spectra in changing C ratio. At above 30 wt% carbon, the Nyquist plot of composite electrodes composed of one semicircle at high frequency followed by a linear part at the low-frequency end. At below 30 wt% carbon, the semi-circle becomes too small to be observed and only the linear part is clearly seen. The inset of figure 16 is the enlargement of high frequency segment of composite electrode MnO2/30 wt% graphite carbon. In order to understand the evolution of impedance parameters, the Nyquist plot is fitted to the respective electronic circuit model shown in figure 17. Rs represents the electrolyte resistance (equivalent to high frequency intercept on the real Z or x axis), Rct is charge transfer resistance (equal to diameter of the semicircle), C1 is double layer of surface capacitance, a Warburg impedance W arising from a diffusion-controlled process at low frequency. For ideal capacitive behavior, the line in low frequency region should be parallel to the imaginary z axis forming a 90° slope. Here, C2 was used because low frequency behavior is not purely capacitive. These non-ideal natures of capacitance arise due to non-homogenous nature of the electrode [27]. As seen in figure 16, the experimental slope is approximately closer to 90° at 30 wt% carbon which indicates a predominantly capacitive behavior. At low C ratio, the slope is much smaller than 90°. At high frequency region, the low intercept at the real z axis (1.7–2.5 Ω) indicates the small Rs of whole composite electrodes. Besides, at high C ratio, Rct from the fitting result also represents the lower charge transfer of MnO2/C electrodes in contact with electrolyte as well as higher capacitance value (C1 and C2) compared to those at low C ratio. The good compromise values of C and Rct were obtained at the 30 wt% carbon. Therefore, the lowest charge transfer and ionic resistance of MnO2 electrode are consistent with the microstructure, morphology and also SSA value at this carbon ratio.
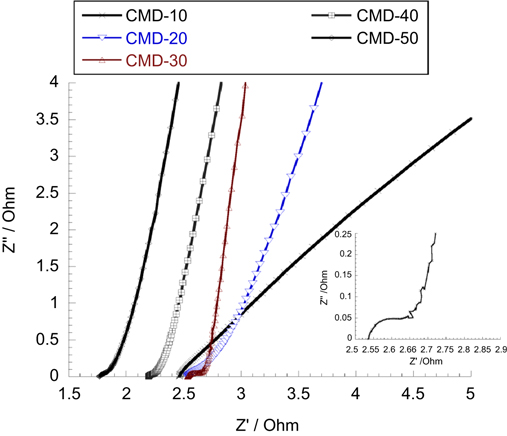
Figure 16. Nyquist plot of MnO2/C electrode composite at different carbon ratios measured in 2 M NaCl. Inset shows the enlarged scale at high frequency region of MnO2/30 wt% carbon graphite.
Download figure:
Standard image High-resolution image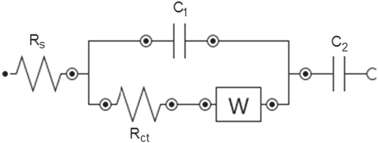
Figure 17. Schema of equivalent circuit model for fitting.
Download figure:
Standard image High-resolution image
4. Conclusion
Flower like nanostructured manganese dioxide and porous nanostructured composite electrode of MnO2/C can be easily synthesized by chemical reduction. All samples exhibited -MnO2 as a principal phase. The use of templated carbon affects the Csp of composite electrodes in aqueous and non-aqueous solution due to the change in the microstructure and specific surface area of samples. We found out that both the microstructure and the porous characteristics play vital roles in determination of capacitive characteristics of MnO2/C composite electrode. At 30 wt% carbon, the electrode shows good compromise of specific capacitance and specific surface area. In addition, impedance spectra result shows ideal capacitive behavior as well as the low Rct at 30 wt% carbon of MnO2/C. The highest capacitance obtained with MnO2/30 wt% super P carbon composite electrode in aqueous and non-aqueous solution, 205 F g−1 and 106 F g−1, respectively. The obtained result is consistent with the microstructure observation (nanometer-scale particles and porous structure) and also with the specific surface area. Therefore, this material is a promising candidate for the electrochemical supercapacitor electrode.
Acknowledgments
We gratefully acknowledge the financial support of Vietnam National University in Ho Chi Minh City (VNU-HCM) under the grants B2011-18-01 TD and HS2013-76-01. The authors would like to thank Office of Naval Research Global (ONRG) for the grant N62909-13-1-N235. We thank Rachel Martin and Stéphane Coindeau (Grenoble-INP, France) for their technical support. The authors express sincere thanks to Professor Nguyen Van Hieu (VAST) and Professor Nguyen Thi Phuong Thoa (VNU-HCM) for their great support, encouragement and discussion.