
Abstract
A fluid density sensor based on resonance frequency change of a metallic tube is presented. The sensor has been developed without using a complex micro-fabrication process. The sensor is able to identify fluid types/contaminations and improve the performance by reducing testing time, decreasing complexity of testing equipment and reducing sample sizes. The sensor can measure the resonance frequency of its own structure and determine the change in resonance frequency due to the subsequent sample inside the tube. Numerical modelling, analytical modelling and physical testing of a prototype sensor showed comparable results for both the magnitude and resonance frequency shift. The modelling results yielded a resonance frequency shift of 200 Hz from 9.87 kHz to 9.67 kHz after the water was filled into the tube. The actual testing illustrated a resonance frequency change of 280 Hz from 9.11 kHz to 8.83 kHz. The ultimate aim of the work is to determine resonance frequencies of desired samples at a level that could detect genetic disease on a cellular level.
Export citation and abstract BibTeX RIS

Original content from this work may be used under the terms of the Creative Commons Attribution 3.0 licence. Any further distribution of this work must maintain attribution to the author(s) and the title of the work, journal citation and DOI.
1. Introduction
With the population of the planet having increased by approximately 280% since 1950, predictions based on world census figures as of 2010 indicate that the global population will reach a figure close to 11 billion people by the end of the century [1]. Such increases in population cause expected increases in human to human interactions. With increased interactions, come increased transmission of viruses, bacteria and other diseases. It also leads way to increases in the number of cases of genetic diseases through increased reproductive blood lines. Consequently, testing of food and water samples has become increasingly important, and more samples need to be tested in shorter times [2]. Numerous biosensors based on optical, gravimetric, thermal, and electrical principles have been developed in order to improve some aspects of performance [3, 4]. Unfortunately, most of these techniques still require sample preparation and continuous monitoring over long periods.
This paper aims to develop a platform for end user devices that would be able to detect certain diseases and infections through the methods of detecting resonance frequency shift. Current methods for testing include observations and inspections of blood sample states and progressions. This requires technicians to be trained medically in order to understand the results that have been received through each testing method. With frequency measurement based devices implementing accurate mathematical testing, the error presented within some of the current technologies (the main errors being human related) could be reduced. Creating a standard of testing that can be computer based will increase accuracy and efficiency. These increases (efficiency especially) will enable testing laboratory staff to be more focused on other areas of testing procedures that are currently unable to be computer based. With the design of these resonant tube structures, devices could be made into micro electromechanical systems (MEMS) scale products. As MEMS devices can be made from small amounts of materials and essentially constructed in the hundreds of thousands to millions of units quickly and efficiently, costs of the devices and complexity of the devices can be greatly reduced [5, 6]. This decreased complexity and cost means that the devices can be implemented in regions of great poverty and less development. Regions categorized in this regard, generally hold a higher need for disease and infection testing as the prevention methods are usually not as readily available and education is often lacking in comparison with more fortunate regions. As an example, two thirds of the approximately 16 million people affected with the human immunodeficiency virus (HIV) reside in Africa [7]. With such a high population of HIV infections (and high population in general of over 1000 000 000 [1]) in a continent supporting some of the poorest nations in the world; cheap, effective and simple disease and infection testing would be of great importance. Therefore, developing such a device means that not only could it be made available cost effectively, but could also be made to a standard that allows technicians not trained in the typical laboratory testing standards, to be able to use the devices and read the results almost instantly. As the testing would be extremely efficient in a timeframe, decisions could be made to begin quarantine/treatments much sooner than sending samples to labs. Depending upon the final design of the device (interface and application), the results could be detected in almost real time as the patient provides the sample (or as the medical professional obtains it).
Some Lab-On-Chip systems for rapid detection of bacteria and chemicals have been proposed. Single cells and nanoparticles were able to be weighed by micro-cantilevers [8]. This sensor includes impedance-based devices to count the number of bacteria in the sample. Resolving small mass changes requires the resonator to be light and to ring at a very pure tone—that is, with a high quality factor. Placing the solution to be detected inside a hollow resonator surrounded by vacuum enables elimination of viscous damping, thereby increasing the mass sensitivity. Also, a CMOS-compatible resonant device for fluid density measurements was proposed in [9]. By sacrificial aluminium etching, a hollow silicon tube was micro-fabricated to measure resonance frequency change in fluid samples with a high response and accuracy. Similarly, a silicon resonant tube with a tuning fork shape was proposed to increase the mass resolution [10]. However, forming a long and narrow hollow micro-tube is a complicated process utilizing semiconductor technology. It requires either a two-layer bonding process [8], or a long-time anisotropic silicon etching process [9]. Also, as samples become smaller, the solution in which the sample is delivered tends to break down and reduces the fluidity of the sample making it difficult to introduce to the sensor. This therefore leads to increased complexity of delivery methods. A simple and low-cost polymer resonator for bio-chemical sensing was reported recently [11], however, the resonance frequency and quality factor were not very high.
This paper proposes a simple resonant mass sensor using a piece of low-cost metallic tube. Without using complex micro-fabrication process, the sensor is able to identify fluid types/contaminations and improve sample testing by reducing sample testing time, decreasing complexity of testing equipment and reducing sample sizes. The ultimate aim of the paper is to be able to determine resonance frequencies of desired samples at a level that could detect genetic disease on a cellular level.
2. Design and simulation
Resonance frequency is the frequency at which a system oscillates/vibrates with relative maximum amplitude. If a conductive material, such as a metallic tube, is placed within a magnetic field, it experiences Lorentz forces perpendicular to the lines of the magnetic field (in a direction depending on the direction of flow of electrical charge within the material). When an alternating current is applied to the same metallic material, the magnitude and direction of the forces oscillate with respect to the frequency of the alternating current (as the current charge changes from positive to negative). In the range of frequencies of oscillation, there will be a resonance frequency from which a maximum amplitude (voltage or displacement for this example) peak can be detected.
2.1. Modelling resonance frequency in a tube with two fixed ends
Figure 1 shows the longitudinal view of a thin tube with each end fixed, which allows the system to be modelled mathematically. For this mechanical system, the natural and harmonic frequencies of oscillation are well known from slender beam theory [12]. Utilizing the known values of the mechanical properties and geometry of the system, the following mechanical vibrations equation can be derived

where E is elastic (Young's) modulus, I is 2nd moment of area, A is cross-sectional area, l is length of beam/tube, ρ is density of the tube material and βl is a constant (i.e. eigenvalue) corresponding to the mode of vibration of the structure.

Figure 1. Diagram showing the model representation of the resonant tube system.
Download figure:
Standard image High-resolution imageThe equation (1) represents a solid beam with two fixed ends although the project utilizes a thin tube filled with liquid as opposed to a solid beam. Therefore, the equation has to be modified to support the required system. The simplest way to do this is to assume that the only effect of the liquid sample is to increase the mass per unit length of the system. With this assumption, the elastic modulus E remains the same as that of the metal tube material. This can be justified in that the sample is a liquid typically having elastic properties of a couple orders of magnitude smaller than those of the solid. In addition, the liquid may flow when subjected to shear, tension and compression forces reducing its contribution to the elastic properties of the system. The second moment of area for the system is taken to be that of the tube

where r2 and r1 are the outer and inner radii, respectively.
The cross-sectional area is independent for each system, with this system in question yielding


The length of the tube is taken as the internal distance between the fixing points. Although the length of the tube was longer than that to allow sample delivery, by assuming the supports are rigid, mathematical modelling of the system becomes significantly simpler than it would be if it was necessary to account for more flexible end constraints.
In deriving equation (1) the mass per unit length is given by the product ρA. To correct for the presence of the sample equation (1) simply needs to be modified by replacing ρA with

This then shows the implications of the sample-filled tube structure on the system model.
The final component to the equation is the vibration mode βl (i.e. dimensionless eigenvalue for the natural frequency). This represents the way in which the structure is expected to vibrate. The expected vibration mode for the system was taken to be β1l = 4.73. This corresponds to mode 1 of a slender beam with two rigid (clamped) fixed end supports [12].
2.2. Simulation results
The densities of air (no sample in the tube) and water are 1.2041 kg m−3 and 1000 kg m−3 (approx.), respectively. The ideal sample system would be the system that yielded the greatest difference in resonance frequency between the two samples. Therefore, the model was used to determine the ideal dimensions for the tube structure from the materials available. At the time of testing 304 stainless steel tubing was available in a variety of sizes. To give a varying range of results, the three different sized tubes were investigated, as illustrated in table 1.
Table 1. Dimensions and simulation results in 3 different sized tubes.
| Length (mm) | r2 (μm) | r1 (μm) | Resonance frequency (air, kHz) | Resonance frequency (water, kHz) | Resonance frequency shift | |
|---|---|---|---|---|---|---|
| Tube 1 | 10 | 225 | 115 | 22.3 | 21.8 | 2.2% |
| Tube 2 | 10 | 165 | 65 | 14.8 | 14.6 | 1.4% |
| Tube 3 | 10 | 100 | 50 | 9.87 | 9.67 | 2.0% |
The results represent the varying tube dimensions for the system. The frequency shifts are around 2% for the 3 tubes. Tube 3 was chosen to model with IntelliSuite and final prototype due to the ease of soldering. The secondary method for modelling the system was undertaken with the 3D MEMS software package IntelliSuite by Intellisense. This package allows the user to create a 3-dimensional model of a system and then simulate it using several different methods for different parameters. The tube that was designed and tested was a thinner tube with an outer diameter of 0.2 mm, an inner diameter of 0.1 mm, and a length of 10 mm. The tube was constructed in 3D builder and then the model was exported to the simulation software within the IntelliSuite package to simulate the system with forced vibration.
Figure 2 represents the modal analysis of the tube at first resonance frequency in IntelliSuite. The results of the 3D model illustrates that tube 3 with air has a resonance frequency of 9.97 kHz, which is closely matched with the analytical model result of 9.87 kHz.
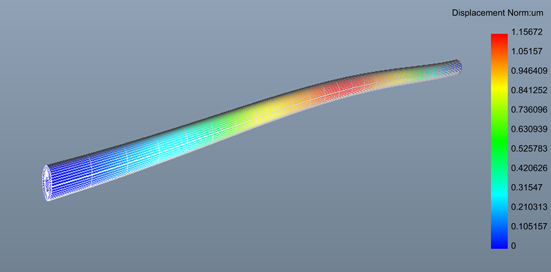
Figure 2. Modal Analysis in IntelliSuite for tube 3 with air inside at the first resonance mode.
Download figure:
Standard image High-resolution image3. Experimental details
3.1. Prototyping of sensors
The completion of a modelling base leads the way to the prototyping phase of the sensor. The prototyping was set about with three main focus points: simplicity, ease of modification, and conformability to theory. This implies that it is necessary to remain true to the design parameters that were utilised for the mechanical vibrations equation model, by retaining a single tube structure with two fixed ends. It is also expected that the prototype is simple and is able to be modified if required.
The tube was soldered to one piece of PCB substrate with the second substrate resting on top of the first. The two magnets hold each piece of substrate in place.
Figure 3 shows the schematic of the prototype. The tube is soldered on a PCB substrate. The two PCBs are then held together via the attracting force of the magnets. The magnetic field is strong as the gap between two magnets is small, being defined by the thickness of the PCBs and the soldering point. Figures 4(a) and (b) are photographs of the prototype. It can be seen that the tube is soldered in place at each end with testing points wired into the substrate. Utilising the PCB substrates allows for electrical connections to be made directly to the solder points, rather than to each end of the tube.
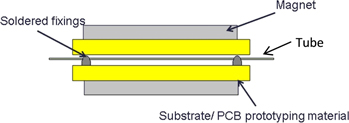
Figure 3. Schematic of the tube being soldered on a PCB prototyping substrate.
Download figure:
Standard image High-resolution image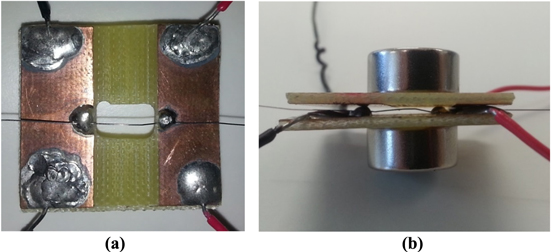
Figure 4. Photographs of the prototype showing soldering of tube and test wires. (a) top view, (b) side view.
Download figure:
Standard image High-resolution image3.2. Theoretical approach to testing
The basis for testing relies upon detecting the resonance frequency of the sensor's tube and its vibrations. As previously stated, the resonance frequency observed within this experiment is modelled through mechanical vibrations. The vibrations of this system and frequency of the vibrations are measured with respect to oscillation displacement. In order to measure the displacement and frequency of displacement, a system of measurement would be required to first register movement in the tube laterally, then determine the magnitude of this displacement and then finally obtain the frequency at which the displacement is oscillating. To record such measurements would take sophisticated equipment and intensive research methods to create testing procedures. Measurements of this order would also be expected to be quite costly to implement. As such, it is ideal to view the resonance frequency from a different perspective. Resonance frequency is a property that is shared by not only mechanical systems, but other systems such as sound and electricity; and more specifically, the voltage. In this regard, it is also ideal to view the resonating tube as a form of ac induction. First, it is necessary to recall Faraday's first law of induction: 'To induce a voltage across a wire, there must be a relative motion between the wire and the magnetic field' [13]. If a magnet is placed in close proximity but in a stationery position to a conductive wire, the magnetic flux (field) will have no varying effect on the wire. If the same magnet is then displaced (still remaining in close proximity), a voltage will be induced in the conductive wire. 'The voltage induced is proportional to the rate of change in the magnetic flux encountered' [13]. From this it can be stated that the speed and frequency of the displacement governs the value of the voltage across the wire. Knowing these laws of induction, a method for measurement can be derived. The resonant tube system can be viewed as a simple ac inductor. As the tube displaces in an oscillating fashion perpendicular to the lines of the magnetic field, it creates relative motion between the magnetic flux of the magnets and the conductive tube. It can be noted that at the peak displacement (at resonance frequency), the displacement magnitude and velocity are at maximum values. These maximum values will then yield maximum voltage change over the conducting tube as the rate of change of the magnetic flux will be at its greatest; Faraday's second law. From these two key characteristics, the vibration of the tube can then be viewed as a voltage source. As such, determining the resonance frequency can be achieved by finding the frequency of the voltage that gives the highest peak voltage.
3.3. Testing apparatus selection
The test apparatus, as previously discussed, was required to measure voltage peaks at varying frequencies. This meant that the equipment was required to be able to supply an oscillating/alternating current input with a fixed value, and then vary the frequency over a specified range and observe voltage change over the vibrating tube; essentially measuring the voltage output of the vibrating tube for each frequency step along the desired spectrum.
The equipment utilised was the Signal Recovery 7265 DSP Lock-in Amplifier (LA). The LA is a device that is able to extract specific signals from within carrier signals and noise floors. The LA can be viewed as a very specific band pass filter, where it allows only the target frequency to be observed and all other frequencies are ignored. The only issue with an LA is that only the target frequency can be viewed. This then requires each individual frequency to be investigated (resolution as fine as 0.001 Hz) in order to determine a peak amplitude. Figure 5 shows the configuration for the LA during testing. The oscillating input and the LA are both part of the complete Signal Recovery 7265 DSP Lock-in Amplifier.
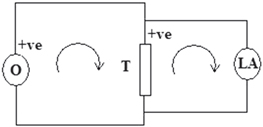
Figure 5. Diagram showing the setup for the lock-in amplifier and the direction of current flow. (O: oscillating input, T: resonant tube, LA: lock-in amplifier).
Download figure:
Standard image High-resolution imageIn order to scan each frequency, a computer program was utilised that scanned the required frequencies at intervals set by the user, over a range set by the user. The computer program was a software package developed in the scientific and engineering measurement and analysis program 'LabVIEW'. Utilising the program, the frequency range was selected based on the modelling results; with a larger range and resolution selected to account for occurrence of inaccuracy in modelling. Once the resonance peak was located within the spectrum, the range was reduced and the resolution increased to obtain accurate results with very fine steps in frequency.
4. Results and discussions
Figure 6 illustrates the testing results of resonance frequency shift after applying a water sample in the tube. The resonant tube with air inside was tested initially with a resonance frequency of 9.11 kHz. Then a medical fluid delivery system was utilised for sample delivery purpose. It includes a syringe with a modified intravenous drug delivery port, which allows the syringe to inject the fluid into the tube. The end of the delivery port branches off to a tube seal to allow the bleeding of air from the delivery system. After injecting the water sample inside the tube, the tested peak frequency shifted to 8.83 kHz as predicted due to the increased mass in the resonant tube. Therefore, the resonance frequency shift is 280 Hz, which matches closely with the modelled result of 200 Hz (shift from 9.87 kHz to 9.67 kHz).

Figure 6. Resonance frequency peak shift after applying a water sample in the tube.
Download figure:
Standard image High-resolution image
5. Conclusion
From the research, development and testing, a device was created that could measure the resonance frequency of its own structure and then implement a sample fluid and determine the change in resonance frequency due to the subsequent sample. Numerical modelling, analytical modelling and physical testing of a prototype sensor device achieved comparable results for both the magnitude and change in resonance frequency. The simulation results yielded a resonance frequency shift of 200 Hz from 9.87 kHz to 9.67 kHz after the water was filled into the tube. The actual testing illustrated a resonance frequency change of 280 Hz from 9.11 kHz to 8.83 kHz, i.e. agreed well with the simulation result.
Acknowledgements
The authors would like to thank Mr John Lodge for his assistance with device prototyping and measurement. This work was supported by Griffith University, Simon Fraser University Collaborative Travel Grant.