

Abstract
We have investigated the hydrogen storage ability and the effect of hydrogenation on structure and physical properties of Ti/V and their oxides-based thin films. A series of Ti–TiO2 and VOx–TiO2 thin films with different layer structures, geometries and thicknesses have been prepared by the sputtering technique on different (Si(111), SiO2, C) substrates. For the Ti–TiO2–Ti films up to 50 at.% of hydrogen can be stored in the Ti layers, while the hydrogen can penetrate without accumulation through the TiO2 layer. A large hydrogen storage was also found in some V2O5–TiO2 films. Hydrogen could also remove the preferential orientation in the Ti films and induce a transition of V2O5 to VO2 in the films.
Export citation and abstract BibTeX RIS

Original content from this work may be used under the terms of the Creative Commons Attribution 3.0 licence. Any further distribution of this work must maintain attribution to the author(s) and the title of the work, journal citation and DOI.
1. Introduction
Hydrogen has been generally accepted as a fuel in the future. There is currently a lot of hope in hydrogen-based energy. The construction of hydrogen-based energy systems brings up new issues, such as the interaction of hydrogen and matter in the solid state, the search for hydrogen storage materials etc This work is a review of our recent work of investigations of the hydrogen storage as well as the effect of hydrogenation on structure and physical properties of Ti and TiO2-based thin films. Some new data obtained for V and VOx-based thin films will be also presented.
Titanium dioxide, TiO2, has been widely used as pigments and paints [1], in the optical coatings for laser mirrors, interference filters, etc [2, 3]. Its photocatalytic properties (i.e. breaking water into hydrogen and oxygen on TiO2 electrodes) have been discovered by Fujishima and Honda since 1972 [4]. TiO2 nowadays finds various novel applications in photoelectrochemistry, photocatalysis, solar cells and gas sensors [5–7]. For an extensive overview of the development of TiO2-based photocatalysis and its future prospects, see [8–10].
An increased interest in TiO2 has been recently focused on the development of its nanostructured forms (nanotubes, nanorods, etc) for renewable energy sources and hydrogen economy. For example, TiO2 nanotubes grown on Ti substrates by anodization could be used for hydrogen storage [11]. Metal–insulator–metal (MIM) structures such as Ti/TiO2/Pt were proposed for resistance random access memories (ReRAM) [12, 13]. Light induced metal-semiconductor reversible transition at room temperature has been demonstrated for TiOx nanoparticles making it a promising material for high density storage media [14].
The vanadium oxide family (V2O5, V2O3, VO2) is among the most attractive class of smart materials exhibiting semiconductor–metal transition. Vanadium pent-oxide (V2O5), the most stable vanadium oxide having a wide band gap and being an n-type semiconductor material, has been used especially as optical and electrical devices, e.g. V2O5 thin films can be applied in electrochromic and electrochemical devices [15] and microscale batteries [16]. A large interest is focusing on investigations of TiO2–V2O5 thin films to gain the optimal electrochromic properties [17] regarding their potential applications for electrochromic smart windows. The interaction of V2O5 with TiO2 would strongly affect the structural properties and reactivity of V2O5; in particular, it leads to V2O5 dispersion [18, 19]. We notice here that due to oxygen reduction by using e.g. hydrogen, V2O5 can be converted to vanadium dioxide VO2 and a complex mixture such as V4O7 and V5O9 before V2O3 is reached. The promoting effect of a titanium oxide support on the catalytic properties of vanadium oxide is widely recognized [20]. Investigations of thermochromic properties have revealed that VO2–TiO2 multilayers have a higher luminous transmittance than that of single VO2 film and could yield a large change of solar transmittance at both temperatures below and above semiconductor–metal transition temperature (∼333 K) of VO2 [21].
Introduction of hydrogen into the crystal lattice in general leads to a modification of both crystal and electronic structure. Hydrogen absorption brings a relatively small perturbation to the system (e.g. the lattice expansion and the hydrogen bonding with other atoms in the lattice). It, however, often implies some new and interesting features in the systems. Thin films and multilayers often play an important role in the improvement of hydrogen absorption rate as well as the chemical and crystal structure stability. On the other hand, the atom mixing, diffusion across the interfaces and precipitation of nanoparticles may also affect the hydrogen uptake-release cycling as well as the thermodynamic properties of the films.
We aim at characterization of the film structure and properties of the TiO2-based thin films, in particular the interlayer properties and the influence of hydrogen intake on the microstructure and electronic structure of the films. Numerous TiO2-based thin films, consisting of TiO2, Ti and VOx layers with a different layer structure (e.g. with single-, bi- and tri-layer structure of different layer sequences), have been prepared by means of sputtering technique and investigated. Selected films subjected for hydrogenation were then investigated focusing on film stability, hydrogen uptake and hydrogen storage under different conditions. Details of the experiments and the main outcome of our study are presented in the next sections.
2. Experimentals
Thin films consisted of Ti, TiO2 and VOx layers with different layer sequences and different layer-thicknesses have been deposited by means of magnetron dc pulse sputtering system [22] on Si(111), silica SiO2 and C-foil substrates. Our analysis of all investigated layers indicates the presence of TiO2 rutile, while several vanadium oxide forms (V2O5, VO2...) can exist. For the selected film, an additional Pd layer was deposited on the film surface by MBE technique.
Selected films with chosen film-structure have been subjected to hydrogenation at atmospheric atmosphere (1 bar) and at 300 °C (so-called hydrogen charging) and/or at high hydrogen pressure up to 102 bar and at room temperature (RT) with different times. For the VOx–TiO2 series, some samples were charged with hydrogen at 1 bar only once, while some were charged twice. Each charging was for 3 h.
For investigating the possibility of enhancement of hydrogen absorption in the thin film system, an additional palladium layer was deposited on a chosen film by molecular beam epitaxy (MBE) technique.
The film chemical composition, depth profile, layer thickness and structure were determined by combined analysis of x-ray diffraction (XRD), x-ray reflectometry (XRR), Rutherford back-scattering (RBS) and optical spectrophotometry. In order to compare the layer-thickness determination from three independent complementary methods, we also evaluated the layer thickness in nm from RBS data. More details of RBS analysis are described elsewhere [23, 24].
The hydrogen profile was determined by means of a secondary ion mass spectroscopy (SIMS) and N-15 Nuclear Reaction Analysis (15N-NRA method). SIMS was carried out by using Cs+ primary ions recording positive secondary ions by a CAMECA ims 5f equipment. The reaction 15N + 1H → 12C + α + γ (4.965 MeV) at a resonance energy of 6.417 MeV was used for the 15N-NRA method to obtain the results. For data evaluation the computer code SRIM was used.
3. Results and discussion
3.1. Hydrogen storage in Ti–TiO2 films
Hydrogen storage in these systems have been thoroughly investigated and reported in our previous publications [25–27]. Our investigations revealed that:
- I.On the as-deposited films of Ti-TiO2 system:
- 1.Single Ti nucleates and grows as a compact layer on the well-defined (111) plane of Si wafer– Ti/Si(111). Interdiffusion was not found at the Ti/Si interface, i.e. a sharp interface was always obtained. This Ti film exhibits a strong preferred orientation with (00.1) plane parallel to the substrate,
- 2.A small amount of interdiffussion was found at the Ti–TiO2 interface of the bi-layer film and at both Ti–TiO2 and TiO2–Ti interfaces of the tri-layer film. The intermediate TiO2 layer exhibits columnar structure and there is some intergrowth between the Ti and TiO2 layers. The interdiffusion is attributed to Ti diffusion along the channels formed between the TiO2 columns,
- 3.More precise determination of layer thickness and element concentration, in particular the oxygen concentration, can be obtained for films deposited on C-foils. However, in this case a strong carbon diffusion (up to 10 at.%) into the film was observed. If the film is thin (the layer thickness <30 nm), the carbon can be found even in the surface layer due to carbon segregation from the substrates,
- II.On hydrogen-charged Ti–TiO2 films:
- 4.High hydrogen concentration (storage), up to a value of over 40–50 at.%, was obtained for the top Ti-layer,
- 5.Palladium could act as a good catalyst for hydrogen diffusion in the Ti–TiO2–Ti films. Without covering the film surface by palladium, the hydrogen concentration in the bottom Ti layer has reached only 15 at.%, whereas it increases up to 40 at.% when the film was covered by palladium,
- 6.Hydrogen could be moved through TiO2 layer without any accumulation there,
- 7.The preferential orientation in the Ti films was destroyed/disappeared by hydrogen charging under high pressures (pH2 = 100 bar),
- 8.Large swelling effect was observed for the thick Ti layer (>240 nm) after hydrogen charging at 100 bar. The enhanced hydrogen concentration (enhanced storage) leads to an increase of the film thickness up to 150% of its original value.
The hydrogen profile determined by 15N-NRA for the Ti/TiO2/Ti/Si(111) films revealing the large hydrogen storage up to 40–50 at.% is shown in figure 1. More detailed results can be found in our previous publication [26].
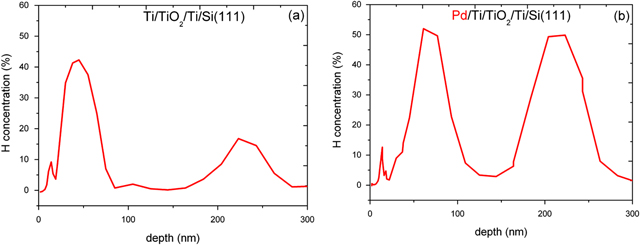
Figure 1. Comparison of the hydrogen profile determined by 15N-NRA for the Ti/TiO2/Ti/Si(111) film (a) without covering Pd and with Pd cover (b). The hydrogen charging was at 1 bar and at 300 °C.
Download figure:
Standard image High-resolution image3.2. Hydrogen storage in VOx–TiO2 films
Prior to the hydrogenation experiments, we have studied thoroughly the properties of layered structures of numerous VOx–TiO2 films with different film-geometry and thickness. The measured and simulated RBS spectra for the 5 films deposited on silica SiO2 substrates are shown in figure 2. Estimated layer composition and thickness for each layer in the films are given in table 1.

Figure 2. Random RBS (markers) and SIMNRA (lines) simulated spectra for (a) 79 nm thick V2O5/SiO2 (sample VS1) and 122 nm thick V2O5/TiO2/SiO2 (VS2) and (b) 117 nm thick TiO2/V2O5/SiO2 (VS3), 184 nm thick TiO2/V2O5/SiO2 (VS4) and 193 nm thick TiO2 + V/SiO2 (VS5) after deposition. RBS experiments were performed with the incident He+ ion energy of 1.7 MeV and the backscattering angle of 171°. The films are denoted by nominal chemical composition and the estimated total thickness (see table 1). The curves were normalized and shifted for clarity.
Download figure:
Standard image High-resolution imageTable 1. Chemical composition of TiO2–VOx films deposited on silica SiO2 substrates after deposition (as-deposited films): V2O5/SiO2 (denoted as sample VS1), V2O5/TiO2/SiO2 (VS2), TiO2/V2O5/SiO2 (VS3 and VS4, with the same layer geometry but different thickness) and TiO2 + V/SiO2 (VS5). The layer-thickness of each layer (d (nm)), the percentage (%) of each type of oxides (TiO2, V2O5, VO2) presented in the film are estimated using SIMNRA and the mass density of the bulk (see text). Layer (1) denotes the surface layer. The layer (2) of sample S1 consists of V2O5−x with x = 0−3.0 (see text).
| Layer | V2O5 (%) | TiO2 (%) | VO2 (%) | SiO2 (%) | d (nm) | D (nm) | |
|---|---|---|---|---|---|---|---|
| V2O5/SiO2 | 1 | 100 | — | — | — | 13 | 79 |
| (VS1) | 2 | 100 (V2O5−x) | — | — | — | 51 | — |
| — | 3 | — | — | 100 | — | 15 | — |
| V2O5/TiO2/SiO2 | 1 | 100 | — | — | — | 68 | 122 |
| (VS2) | 2 | — | 85 | 9 | 6 | 54 | — |
| TiO2/V2O5/SiO2 | 1 | — | 100 | — | — | 53 | 117 |
| (VS3) | 2 | 100 | — | — | — | 64 | |
| TiO2/V2O5/SiO2 | 1 | — | 100 | — | — | 113 | 184 |
| (VS4) | 2 | 100 | — | — | — | 71 | — |
| TiO2 + V/SiO2 (VS5) | 1 | — | 97 | 3 | — | 193 | 193 |
The RBS spectrum of V2O5/SiO2 film (VS1) is characterized by a large V-peak at energy around 1250 keV from the film, a steep Si- and O edge from the substrate, respectively, at 960 keV and 616 keV. Oxygen is present both in the film and in the substrate, thus no separated oxygen signal from the film was observed; its presence implies some increase of the signal on the left-hand side of the O-edge (below 616 keV) in the RBS spectra. The film structure can be described as follows: 1) the upmost surface layer of the film indeed consists of the most stable and common vanadium oxide V2O5 with a thickness of 13 nm (denoted as layer 1 of sample VS1 in table 1), 2) beneath the V2O5 layer is a thick layer with a composition of V2O5−x (layer 2) with x increasing from 0 to 3.0 and thickness of 51 nm, 3) beneath the V2O5−x layer is the stoichiometric VO2 layer with a thickness of 15 nm (layer 3) and 4) an interface layer consisted of a mixture of VO2 + SiO2 was formed as a consequence of V diffusion deeply into the SiO2 substrate (revealed by the non-zero background between the V-peak and Si-edge). A more detail analysis of the mixture layer V2O5−x (layer 2, thickness 51 nm) indicates that it consists of two sub-layers, the first one with a thickness of 24 nm beneath the surface V2O5 layer 1) is as a mixture of V2O5, V2O7 (i.e. x = 1.5) and V5O9 (x = 1.4), while the second one (above the VO2 layer 3) with a thickness of 27 nm is a mixture of V2O3 layer (x = 2.0) and VO (x = 3.0).
Our results indicate that during film deposition, first the VO2 layer was formed on SiO2 substrate (with an oxygen content of 33.3%). With increasing deposition time, the oxygen content increases to a higher value to form the mixed V2O3 + VO layer (with the oxygen content of 40–50%). Increasing further the deposition time, the oxygen reduction leads to a formation of layer with a complex mixture of V2O5, V2O7 and V5O9 until the stable V2O5 (with the oxygen content of 28.6%) is reached and formed on the film surface. In all cases, from the estimated value of metal (M) and oxygen (O) content by SIMNRA, the type of oxides consisting in the layer can be easily defined. For instance, the M and O content in M2O5 is respectively 28.6% and 71.4%, while it amounts to, respectively, 33.3% and 66.7% for MO2. The SIMNRA fit for RBS spectrum is simulated for (Nt) product, i.e. the areal density (the number of target atoms per unit area). The values of layer-thickness in (nm) are converted from the simulated (Nt) values (in 1015 atoms cm−2) using the conversion coefficient and estimated percentage (%) of each oxide presented in the layers. For instance, for the stoichiometric V2O5 layer (1) in the sample VS2
while for layer (2) in the sample, VS2 consisted of 85% TiO2, 9% VO2 and 6% SiO2

where m, n, p are the corresponding conversion coefficients estimated using the bulk density of different oxides (e.g. ρ (TiO2) = 4.23 g cm−3, ρ (VO2) = 4.57 g cm−3, ρ (V2O5) = 3.36 g cm−3). In most cases, the thickness could be estimated with a good accuracy, since the layer either consists of only stoichiometric oxide (such as TiO2, V2O5, VO2) or the mixture of oxides of the same type (such as (TiO2 + VO2) or (VO2 + SiO2) mixture). For such a mixture, since the oxygen content is the same (66.7%), the percentage of different oxides can be easily estimated based on the ratio between different M components, e.g. t(%) TiO2 = u(%)Ti/33.3(%) where u(%)Ti is the estimated percentage of Ti in the layer and 33.3% amounts to the summation of percentage of all metal contents in the layer (u(%)Ti + v(%)V + w(%)Si = 33.3(%)). Some difficulty arises in the thickness conversion for the layer consisting of a mixture of different oxides, such as layer (2) of sample VS1 (V2O5−x). In this case, it is more difficult to estimate the exact ratio of different oxides based on only the ratio of M contents, since the O content is different for each oxide. We notice here that besides uncertainty in thickness conversion, the ambiguity in determination of the layer thickness is also related to the layer quality itself. Namely, the sputter deposited films may have some porosities or defects and thus the mass density of the film is certainly different from that of the bulk.
The RBS spectrum of V2O5/TiO2/SiO2 film (VS2) is characterized by a large V-peak at an energy around 1250 keV and a large Ti-peak at an energy around 1200 keV from the film, a steep Si- and O edge from the substrate (at a lower energy than that for the VS1 film, since the film thickness is larger). The thickness of the V2O5 and TiO2 layer are quite similar and so are the V- and Ti-content in the film, thus a clear minimum between the V- and T-peak was observed. The TiO2 was first deposited on the SiO2 substrate and then the V2O5 layer followed in this case. No stoichiometric TiO2 was found. Instead, a mixed layer (TiO2 + VO2 + SiO2) with a thickness of 54 was formed (layer 2, sample VS2) as a consequence from some Si diffusion (6% SiO2) and V-diffusion (9% VO2) into the TiO2 film. However, the surface layer with a thickness of 68 nm consists of only stoichiometric V2O5.
In the case of two TiO2/V2O5/SiO2 films (VS3 and VS4), i.e. deposition sequence is first the vanadium and then the titanium oxide, our analysis reveals that each film consists of only stoichiometric V2O5 and TiO2 layer. For the VS3 film, the thickness of TiO2 (64 nm) and V2O5 layer (53 nm) is in the same order of magnitude. Besides, the film is quite thin. Thus, the V- and Ti- signal was combined into one large peak at around 1200 keV in the RBS spectrum. For the VS4 film, the thickness of TiO2 layer is estimated to be 113 nm, while it equals 71 nm for V2O5 layer (see table 2). Both layers are thicker than those of VS3. Besides, the thickness of TiO2 film is about 1.5 times larger than that of the V2O5 one, i.e. the Ti content in the film is much larger. This leads to the wide shoulder (V-signal) and the large peak (Ti signal) in the RBS spectra. In the case of TiO2+V/SiO2 film (VS5), the V content is estimated to be 1% for the entire film, i.e. the film composition is 97% TiO2 + 3% VO2. Since the film is thick (193 nm) and the V-content is small, only a broad peak was observed in the RBS spectrum.
Table 2. Effect of hydrogenation on selected films: V2O5/TiO2/SiO2 (VS2), TiO2/V2O5/SiO2 (VS4). They were charged by hydrogen twice (denoted, respectively, by H(1) and (H(2)), each charging was at pressure of 1 bar, at temperature of 300 °C and for 3 h. The layer-thickness of each layer (d (nm)), the percentage (%) of each type of oxides (TiO2, V2O5, VO2) presented in the film were estimated using SIMNRA and the mass density of the bulk (see text). Layer (1) denotes the surface layer. Due to enhanced Si diffusion from the SiO2 substrate into the film, the mixed TiO2–VO2–SiO2 layer was formed at the film–substrate interface in all cases. The increased thickness of the film (%) due to hydrogenation was estimated for the total film thickness (D (nm)) with respect to that of as-deposited film.
| V2O5/TiO2/SiO2 (VS2) | Layer | V2O5 (%) | TiO2 (%) | VO2 (%) | SiO2 (%) | d (nm) | D (nm) | Increased thickness |
|---|---|---|---|---|---|---|---|---|
| as-deposited | 1 | 100 | — | — | — | 68 | 122 | — |
| — | 2 | — | 85 | 9 | 6 | 54 | — | — |
| hydrogenation-1 | 1 | 100 | — | — | — | 62 | 131 | 7% |
| H (1) | 2 | 62.5 | 26.5 | 11 | 56 | — | — | |
| — | 3 | 19 | 19 | 62 | 13 | — | — | |
| hydrogenation-2 | 1 | 100 | — | — | — | 62 | 140 | 15% |
| H (2) | 2 | — | 48 | 36 | 16 | 37 | — | — |
| — | 3 | — | 7 | 18 | 75 | 41 | — | — |
| TiO2/V2O5/SiO2 (VS4) | Layer | V2O5 (%) | TiO2 (%) | VO2 (%) | SiO2 (%) | d (nm) | D (nm) | increased thickness |
| as-deposited | 1 | — | 100 | — | — | 113 | 184 | — |
| — | 2 | 100 | — | — | — | 71 | — | — |
| hydrogenation-1 | 1 | — | 100 | — | — | 112 | 184 | 0% |
| H (1) | 2 | 100 | — | — | — | 58 | — | — |
| — | 3 | — | — | 15 | 85 | 14 | — | — |
| hydrogenation-2 | 1 | — | 100 | — | — | 111 | 187 | 2% |
| H (2) | 2 | — | 94 | 6 | 47 | — | — | |
| — | 3 | — | — | 15 | 85 | 29 | — | — |
Estimated layer composition and thickness of VOx–TiO2 films after each charging with hydrogen are given in table 2. We focus on analyzing the hydrogen charging results on sample VS2 (with V2O5 as the surface layer) and VS4 (with TiO2 as the surface layer). These films were charged by hydrogen twice denoted as H(1) and H(2). The increased thickness of the film (%) due to hydrogenation was estimated for the total film thickness (D (nm)) with respect to that of as-deposited film (=(D(after)-D (before))/D (before charging)). As an example, a comparison of the measured and simulated RBS spectra for the V2O5/TiO2/SiO2 film (VS2) before and after hydrogen charging are shown in figure 3. The Ti-peak and V-peak with almost equal intensity before hydrogen charging was observed. The effect of hydrogen charging on this film is revealed by a lowering of the Ti-peak and a widening of this peak at the left hand side. It is caused by a decrease of the percentage of TiO2 in layer 2 as well as the appearance of an extra mixed layer in the interface (see table 2). The total film thickness is increased, respectively, by 7% and 15% after the first and second hydrogen charging. The thickness change is large enough in this case, which can be seen in the RBS spectrum. No visible hydrogen effect can be seen in RBS spectra from hydrogen charging for the other samples (VS1, VS3, VS4 and VS5). A comparison of the measured and simulated RBS spectra for sample VS4 before and after hydrogen charging is shown in figure 4. The RBS spectra before and after hydrogen charging are similar. The effect from hydrogen charging is mostly revealed by the change of the layer content and layer thickness, but the change in the total thickness is in the range of e.g. 2–3% for VS3 and VS4 film.

Figure 3. Random RBS (markers) and SIMNRA (lines) simulated spectra for V2O5/TiO2/SiO2 (VS2) before (as-deposited) and after two times of hydrogen charging (denoted, respectively, as H(1) and H(2) ). RBS experiments were performed with the incident He+ ion energy of 1.7 MeV and the backscattering angle of 171°. The curves were normalized and shifted for clarity. The hydrogen charging was seen by e.g. the relative change in the peak-intensity of Ti- and V-signal.
Download figure:
Standard image High-resolution image
Figure 4. Random RBS (markers) and SIMNRA (lines) simulated spectra for TiO2/V2O5/SiO2 (VS4) before (as-deposited) and after two times of hydrogen charging (denoted respectively as H (1) and H (2)). RBS experiments were performed with the incident He+ ion energy of 1.7 MeV and the backscattering angle of 171°. The curves were normalized and shifted for a clarity. No visible effect from hydrogen charging was seen.
Download figure:
Standard image High-resolution imageWe concentrate on analyzing the most visible effect from hydrogen charging, i.e. on the V2O5/TiO2/SiO2 film (VS2). The hydrogen charging leads to a decrease of the layer thickness of the stoichiometric V2O5 layer (layer 1) from 68 nm to 62 nm, while that of the mixed TiO2 + VO2+SiO2 layer (layer 2) increases from 54 nm to 56 nm after the first charging. The TiO2 percentage in layer 2 is only 62.5%, much lower than that before charging (85%). The VO2 percentage increases from 9% to 26.5%. Besides, an extra layer with the same mixture as that of the layer 2 but with a lower percentage of TiO2 (19%) and VO2 (19%) and a higher percentage of SiO2 (62%) does appear (with a thickness of 13 nm). It can be explained as an enhancement of both Ti diffusion into the SiO2 substrate and Si diffusion out from substrate into the film. We notice here that the film is heated up to 300 °C for 3 h upon hydrogen charging. It certainly promotes such diffusion and as a consequence increases the thickness of the interface layers. Indeed the second hydrogen charging induces a larger enhancement; the percentage of SiO2 in the interface layers is largely enhanced and reached even 75%. Our results clearly show the transition from V2O5 to VO2, or in other words, a reduction of V2O5 and increase of VO2 due to hydrogen charging.
We did not construct the depth profile from the RBS data, i.e. the concentration of each element as a function of the film thickness, just because the relative change between different layers is very small. For a clear demonstration of the hydrogen effect, we construct the film diagram, where the layer thickness of different layers is drawn proportionally with respect to the values given in table 2. Different compositions of different oxides in the layers are presented by using different colours. The film diagram was shown for VS2, VS3 and VS4, respectively, in figures 5 and 6, since the hydrogen charging leads to a change of layer thickness (up to 15%) and composition in these cases by hydrogen.

Figure 5. Illustration of the influence of hydrogenation on the structure and composition of V2O5/TiO2/SiO2 film (VS2). The layer thicknesses are drawn proportionally with respect to the values given in table 2. The solid line indicates the original separation between the film and the SiO2 substrate. Different colours indicate different compositions of different oxides (TiO2, VO2, SiO2) in the layers. The dashed line reveals the film thickness after two times of hydrogenation with respect to that of the as-deposited film (thin solid line). The estimated total film thickness before and after hydrogenation is also given.
Download figure:
Standard image High-resolution image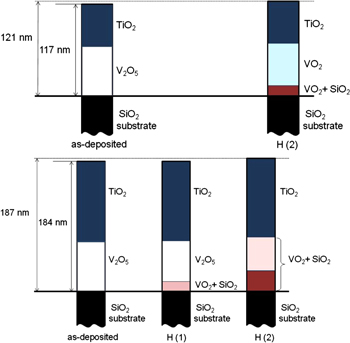
Figure 6. Illustration of the influence of hydrogenation effect on the structure and composition of two films with a similar layer geometry TiO2/V2O5/SiO2 but with a different thickness (VS3 (top), VS4 (bottom)). The layer thicknesses are drawn proportionally with respect to the values given in table 2. The solid line indicates the original separation between the film and the SiO2 substrate. Different colours indicate different compositions of different oxides (VO2, SiO2) in the layers. The dashed line reveals the film thickness after two times of hydrogenation with respect to that of the as-deposited film (thin solid line). The estimated total film thickness before and after hydrogenation is also given.
Download figure:
Standard image High-resolution image
The obtained results on VOx–TiO2 films revealed that:
- (1)Stoichiometric V2O5 and TiO2 layers were obtained if the deposition sequence was first the vanadium and then the titanium oxide,
- (2)The V2O5 reduction upon hydrogen charging, i.e. the V2O5–VO2 transition, was always observed,
- (3)In the case when the V2O5 layer is on the surface, the hydrogen charging effect is much enhanced, indicated by a large increase of the total film thickness (up to 15% of its original value after hydrogen charging of 6 h). It reveals the large hydrogen storage in the film,
- (4)The V2O5 can be well preserved upon hydrogen charging if it locates on the film surface, as in the case of V2O5/TiO2/SiO2 film,
- (5)In the case when the TiO2 layer is on the surface, the film thickness does not change much (only 2–3%) upon hydrogen charging. However, a larger reduction of V2O5 is observed. Namely, after 6 h charging, a complete transition of V2O5 into VO2 can be obtained. It indicates that the TiO2 layer acts as 'hydrogen catalyst' for such V2O5–VO2 transition.
- (6)The results obtained for TiO2 + V/SiO2 film confirmed that no hydrogen is accumulated in TiO2 even if it is doped with vanadium. However, in this case, since the V-doping is very small (1%) and the film is thick, VO2 (3%) exists in the film. Thus there is no possibility to observe the V2O5–VO2 transition.
4. Concluding remarks
The most important finding of our investigations is that hydrogen can be stored largely in the Ti layer (with hydrogen content to 50%) in thin films of Ti–TiO2 system and that palladium could act as a good catalyst for hydrogen diffusion into the films. A large hydrogen absorption can be obtained in the thin films of VOx–TiO2 system if the surface layer is the V2O5 layer. Besides, the introduction of hydrogen could also remove the Ti preferential orientation and/or induce a V2O5–VO2 transition in the films.
Acknowledgments
The authors highly acknowledged the great help and fruitful cooperation of A Brudnik (AGH Krakow), S Flege and C Schmitt (Damstadt University of Technology), D Rogalla and H-W Becker (Dynamitron Tandem Lab, Ruhr-Universität Bochum), R Kužel and V Sechovsky (Charles University). We acknowledge the support of the Czech-Polish cooperation by the Czech Ministry of Education (Czech-polish project 7AMB14PL036 (9004/R14/R15). N-THKN acknowledged the financial support by the European Regional Development Fund under the Infrastructure and Environment Programme.