

Abstract
This work involves the preparation and characterization of alginate nanoparticles (Alg NPs) as a new transdermal carrier for site particular transport of glucosamine sulfate (GS). The GS–Alg NPs were examined through transmission electron microscopy (TEM), Fourier transform infrared spectroscopy (FTIR), differential scanning calorimetry (DSC) and dielectric spectroscopy. GS–Alg NPs was efficiently prepared via ionic gelation method which generates favorable conditions for the entrapment of hydrophilic drugs. The TEM studies revealed that GS–Alg NPs are discrete and have spherical shapes. FTIR studies showed a spectral change of the characteristic absorptions bands of Alg NPs after encapsulation with GS because of the amine groups of GS and the carboxylic acid groups of Alg. The DSC data showed changes in the thermal behavior of GS–Alg NPs after the addition of GS indicating signs of main chemical interaction among the drug (GS) and the polymer (Alg). The absence of the drug melting endothermic peak within the DSC thermogram of GS–Alg NPs indicating that GS is molecularly dispersed in the NPs and not crystallize. From the dielectric study, it was found modifications within the dielectric loss (ε'') and conductivity (σ) values after the addition of GS. The ε'' and σ values of Alg NPs decreased after the addition of GS which indicated the successful encapsulation of GS within Alg NPs. Furthermore, the dielectric study indicated an increase of the activation energy and the relaxation time for the first process in the GS–Alg NPs as compared to Alg NPs. Consequently, the existing observations indicated an initiation of electrostatic interaction among the amine group of GS and carboxyl group of Alg indicating the successful encapsulation of GS inside Alg NPs which could provide favorable circumstance for the encapsulation of GS for topical management.
Export citation and abstract BibTeX RIS

Original content from this work may be used under the terms of the Creative Commons Attribution 3.0 licence. Any further distribution of this work must maintain attribution to the author(s) and the title of the work, journal citation and DOI.
1. Introduction
Nanoparticles (NPs) have become a focal point of interest within the subject of biomedicine which attributed to their ability to deliver diverse drugs [1]. A lot of studies have been focused on the preparation of nanoparticles using biodegradable hydrophilic polymers which includes alginate (Alg) [2]. Alg is water soluble salt of alginic acid, a certainly happening non-toxic polysaccharide found in all types of brown algae [3]. It contains two uronic acids, 1–4 connected β-D-mannuronic acid and α-L-guluronic and consists of homopolymeric blocks M–M or G–G, and alternating blocks of M–G [4]. Alg has been observed increasing biotechnological and biomedical applications in view of its numerous advantages, including high biocompatibility, biodegradability, non-toxicity, non-immunogenicity, chelating ability and the possibility of chemical modification [5]. Alg polymers are also hemocompatible and have not been discovered to accumulate in any major organs and display proof of in vivo degradation [6]. Similarly, it can be completely cross-linked by multivalent cations, such as calcium ions in aqueous media, which alternatively connect with G–G sequences in the Alg chain to shape the 'egg field junctions' [7].
Ionic gelation method is one of the techniques used to prepare Alg NPs [6]. This method offer many benefits as NPs are easily prepared without the usage of organic solvent or high shear pressure [8]. Relying on the degree of such cross-linking, Alg will reduce extensively its swelling in the presence of the solvent, resulting typically a decrease in the permeability of different solutes. As a consequence, the release of medication in Alg matrices can be delayed, permitting these structures to be used in drug managed release [9]. Furthermore, many researchers have used Alg for encapsulation of cells [10], proteins [11], DNA [12], venoms [13] and vaccines [14]. Also US FDA has acclaimed permission for use of Alg [15].
Polymeric NPs guarantees to function as drug carrier for more challenging traditional drugs used for the treatment of chronic diseases including cancer, allergies, high blood pressure, HIV and diabetes [16]. It is far expected that 33% of humans over 45 yr complain of osteoarthritis-related signs. In Europe, glucosamine is registered as a drug authorized for the treatment of osteoarthritis (especially for its symptomatic, performing effect in promoting cartilage and joint fitness) [17]. Glucosamine may be extracted from chitosan and chitin exoskeleton of crustaceans together with shellfish [18] and may be stabilized as a salt, glucosamine hydrochloride or glucosamine sulfate (GS) [19]. Trials showed giant pain alleviation for the GS group as compared to the placebo [20]. GS also confirmed a lower stage of cartilage degradation and synovial infection as compared to the manipulate group [21]. Additionally it showed that enzymatic breakdown of the extracellular matrix is probably decreased by the addition of GS [22].
Different physicochemical methods are being used specifically for NPs characterization to understand their performance in vivo. Previously sodium alginate polymer was characterized by differential scanning calorimetric (DSC) in which its thermal degradation consists of two stages as it showed small endothermic peak followed by an exothermic peak [23]. From the FTIR studies, sodium alginate exhibited featured absorption bands concerning hydroxyl, ether and carboxylic functional groups [4]. Moreover the dielectric studies showed that the conductivity of sodium Alg cross linked films was decreased compared to native Alg after the interaction of Alg with Ca2+ ions [24].
The intention of the proposed work is to formulate and characterize Alg NPs as transdermal transporters to encapsulate anti-arthritic drugs (GS) for treatment of osteoarthritis. The drug–polymer interaction was studied through FTIR, DSC and dielectric spectroscopy studies.
2. Experimental
2.1. Materials
Sodium alginate was supplied by ROTH, Germany. D-GS was supplied by MP Biomedicals, France. Calcium chloride was supplied by Qualikems, India. The materials used are with analytical grade.
2.2. Preparation of alginate NPs
Alg NPs were prepared by controlled gellification method reported by Rajaonarivony et al based on the ionotropic gelation of polyanion with CaCl2 [6]. Solution of Alg with concentration (0.1% w/v) was obtained by dissolving proper amount of polymer in distilled water at room temperature. Then the required amount of CaCl2 was dissolved in distilled water to obtain clear solution with precise concentration (36 mM). After mechanical stirring of Alg solution, 5 ml of CaCl2 solution was added drop wise under gentle stirring to 95 ml of Alg solution to induce gellification. The NPs suspension obtained was stirred for 2 h and kept overnight for stabilization. For GS–Alg NPs, 0.05 gm of GS was mixed with the Alg solution before CaCl2 addition. This mixture was further stirred under room temperature. Finally, the NPs were freeze-dried for storage.
3. Characterization of nanoparticles
Morphological analysis of the Alg NPs as well as GS–Alg NPs was examined using transmission electron microscope (JEM-HR-2100 microscope operated at 120 kV, Japan). Samples of the NPs suspension were dropped onto copper grids. After complete drying, the samples were stained using phosphotungstic acid.
FTIR spectra of the Alg NPs, GS as well as GS–Alg NPs were obtained using FTIR spectrophotometer (Jasco FT/IR 460 plus spectrometer, Japan) equipped with attenuated total reflection (ATR) cell. About 10 mg of sample was compressed with KBr into pellets and introduced onto the ATR crystal followed by acquisition of FTIR spectra over the scanning range of 400–4000 cm−1 with speed 2 mm s−1 at a resolution of 4 cm−1 at room temperature.
DSC analysis was used to characterize the thermal behavior of Alg polymer, GS, Alg NPs as well as GS–Alg NPs. Thermograms were obtained using a Shimadzu DSC-60 system (Serial No, C30454400673—Japan). Samples were lyophilized; about 2.0 mg of lyophilized powder were crimped in standard aluminum pans and heated from 30 °C to 300 °C at a heating rate of 5 °C min−1 under constant purging of dry nitrogen at 30 ml min−1.
The dielectric properties of Alg, GS as well as GS–Alg NPs were studied over a wide range of frequencies and temperatures through dielectric spectroscopy. The samples were compressed manually into pellets using a hydraulic press at compression pressure 50 KN for dielectric measurements. All the pellets prepared were circular in shape, 13 mm in diameter and 0.3 g in weight.
The permittivity ε', loss factor tanδ, and ac resistance (Rac) were measured at different temperatures (30 °C–90 °C) and different frequencies (0.1 Hz–5 MHz) using an impedance analyzer (Schlumberger Solartron 1260, Germany). The measurements were automated by interfacing the impedance analyzer with a personal computer through a GPIB cable IEE488. A commercial interfacing and automation software labview was used for acquisition of data. The error in ε' and tanδ amounts to 1% and 3%, respectively. The temperature of the samples was controlled by a temperature regulator with Pt100 sensor. The error in temperature measurements amounts 0.5 °C. To avoid moisture, the samples were stored in desiccators in the presence of silica gel and left with phosphorus pentoxide (P2O5). Then the samples were transferred to the measuring cell.
4. Results and discussion
4.1. Transmission electron microscopy
It has been known that physicochemical properties of NPs, such as particle shape and size play an important role in cellular interactions which can affect their non-specific uptake into cells and behaviors in biological systems [25]. The morphological characterizations of the Alg NPs and GS–Alg NPs are shown in figure 1. The Alg NPs were seen to be spherical particles with solid dense structure. It has been known that due to large surface area and attractive force between the particles, more chance of aggregation is possible in small sized NPs [26]. However, the TEM view showed that the Alg NPs are discrete which may be due to the presence of highly negative surface charge [27] that leads to strong repellent interactions among the Alg NPs in dispersion and aid in reducing aggregation of the particles. Alg NPs acquired a mean particle size of 38 nm (figure 1(a)) while GS encapsulation increased the particle size to 165 nm using GS concentration of 50% (figure 1(b)) which may confirm the successful encapsulation of GS.

Figure 1. TEM micrographs of (a) Alg NPs and (b) after encapsulation with GS.
Download figure:
Standard image High-resolution image4.2. Fourier transform infrared spectroscopy
In pharmaceutical research, the FTIR spectra of pure drug and NPs loaded with drug can be obtained by using this technique to test drug–polymer interaction and stability of drug [28]. Any disappearance of the FTIR peaks of the encapsulated drug indicates the interaction between the drug and the polymer. The FTIR spectroscopy can be used to study the possibility of chemical interaction between the GS and Alg NPs. The FTIR spectra of Alg NPs, GS–Alg NPs and GS are shown in the curves (a), (b) and (c) of figure 2, respectively.

Figure 2. FTIR spectra of (a) Alg NPs, (b) GS–Alg NPs and (c) GS.
Download figure:
Standard image High-resolution imageThe previous research showed that the IR spectrum of sodium alginate exhibited featured absorption bands concerning hydroxyl, ether and carboxylic functional groups [4]. From literatures, a broad band assigned to stretching vibrations of hydrogen bonded O–H were observed at 3000–3600 cm−1. Stretching vibrations of aliphatic C–H were observed at 2920–2850 cm−1. The band at 1780–1710 cm−1 assigned to stretching vibrations of carboxylic acid C=O. Feature bands at 1615.6 and 1415.3 cm−1 have been attributed to the uneven and symmetric stretching of carboxylate organization O–C–O respectively. The band at 1301.1 cm−1 can be assigned to C–C–H deformation and the band at 1094.1 cm−1 may be assigned to C–O and C–C stretching vibrations of pyranose rings. The fingerprint or anomeric region (950–750 cm−1) was the most discussed in carbohydrates. The band at 948.5 cm−1 was assigned to the C–O stretching vibration of uronic acid residues and the band at 820 cm−1 seems to be feature of mannuronic acid residues [29].
Curve (a) in figure 2 showed the feature absorption peaks determined in sodium alginate. Alg NPs confirmed the vibration peaks at wave numbers of 3431 cm−1 because of OH− stretching, 2924 cm−1 because of C–H stretching, 1767 cm−1 because of C–O stretching of carboxylic acid, 1618 and 1417 cm−1 because of COO− uneven and symmetric stretching, 1321.1 cm−1 due to C–C–H deformation and 1090.1 cm−1 because of C–O–C stretching of pyranose ring.
Curve (b) in figure 2 confirmed a spectral change within the feature absorptions bands of the amino, ether and carboxyl groups. By comparing the FTIR spectra of Alg NPs and GS–Alg NPs, we determined that the foremost distinction amongst them is the disappearance of the peak encountered at 1767 cm−1 in GS–Alg NPs spectrum corresponding to C–O stretching of carboxylic acid (COOH). The disappearance of this peak can be due to the carboxylic acid (COOH) group is involved in electrostatic interaction with NH3 group in GS and this is a clear indication that GS–Alg NPs are formed.
Curve (c) in figure 2 indicates the characteristic and diagnostic bands of GS at 3346.85 and 3291.89 cm−1, due to the overlapping between the hydrogen bonded O–H stretching absorption and amine N–H stretching vibration, peak at 2940.91 cm−1 due to C–H stretching, peaks at 1617.02 and 1540 cm−1 due to amine N–H bending vibration, peak at 1382 cm−1 due to the C–O stretching of primary alcohol (CH2OH) and peak at 1111.76 cm−1 due to C–O–C stretching vibration [30, 31].
Further, the spectrum of GS–Alg NPs (curve (b) of figure 2) showed a shoulder at 1538.92 cm−1 in the amide II region (1575–1480 cm−1) due to the introduction of GS into Alg NPs. This shoulder has been assigned to amine N–H bending vibration, which it's a characteristic peak within the GS spectrum (curve (c) of figure 2) and consequently indicating the presence of GS.
Moreover, the peak corresponding to C–O–C stretching of pyranose ring in Alg NPs was shifted toward higher wave numbers from 1090.55 to 1098.26 cm−1 in GS–Alg NPs. This red shift appeared in GS–Alg NPs is due to the overlapping between the peak at 1090.55 cm−1 in Alg NPs and the peak at 1111.76 cm−1 in GS.
Also we see that the carboxyl peak close to 1417.42 cm−1 in Alg NPs corresponding to symmetric COO– stretching vibration slightly blue shifted from 1417.42 to 1414.53 cm−1 after complication with GS.
Consequently the present modifications within the FTIR absorption bands of GS–Alg NPs may be attributed to an ionic interaction occurred between the carboxyl group of Alg and the amino group of GS suggesting the successful encapsulation of GS.
4.3. Differential scanning calorimetry
DSC is used to investigate any physicochemical interaction between the drug and the matrix polymer. Absence of the drug melting peak in DSC thermogram is generally signs of amorphous or solid solution state of the drug in the polymer [32, 33]. Also, any abrupt or drastic change within the thermal behavior of both the drug and the polymer which appeared as shifts of exothermic and endothermic peaks is commonly related to interactions among drug and polymer [34].
DSC thermogram of Alg polymer, GS, Alg NPs in addition to GS–Alg NPs are shown in curves (a), (b), (c) and (d) of figure 3, respectively. Formerly, it is discovered that thermal degradation of sodium alginate includes two or three stages [23]. While in our examination, the DSC thermograms of Alg polymer, Alg NPs and GS–Alg NPs confirmed small endothermic peak with maximum around 58 °C–76 °C and exothermic peak with maximum around 237 °C–240 °C.

Figure 3. DSC thermogram of (a) Alg polymer, (b) GS, (c) Alg NPs and (d) GS–Alg NPs.
Download figure:
Standard image High-resolution imageIn curve (a) we see the thermogram of Alg polymer in which the dehydration was evidenced by an initial endothermic peak close to 76.96 °C then the decomposition of the biopolymer occurred which represented by an exothermic peak at 240.99 °C. Endothermic peak is correlated with loss of water associated to hydrophilic groups of polymer that has not been removed on drying while exothermic peak resulted from the degradation of polymer due to dehydration and depolymerization reactions most probably to the partial decarboxilation of the protonated carboxylic groups and oxidation reactions of the polymer [35].
It has been recognized that, polysaccharides have a strong affinity for water and their hydration characteristics depend on their structures [36, 37]. Furthermore, they release water at certain temperatures, depending on the type of interaction of water with polysaccharide chains. As an instance, three types of interaction of water and polymer have been recognized in alginate hydrogels. The primary one is the free water that is released within the range 40 °C–60 °C, the second is water linked through hydrogen bonds that is released in the region 80 °C–120 °C and the third one is the extra water tightly related through polar interactions with carboxylate groups that is released up to 160 °C [38].
Curves (a), (b) and (d) suggest that within the Alg polymer, Alg NPs and GS–Alg NPs samples, all the water is released within the range 58 °C–76 °C; so only free water and water connected through hydrogen bonds are detected. The polymer starts to degrade round 240 °C. The degradation peak of sodium alginate has been formerly reported in the literature in this temperature range [39].
The thermogram of the drug (GS) (curve (b)) confirmed a sharp endothermic peak at 218.65 °C which corresponding to its melting point within the crystalline form [40]. But the thermogram of the GS–Alg NPs (curve (d) did not display the melting peak for the GS at 218.65 °C. The endothermic peak corresponding to the drug melting within the GS–Alg NPs becomes depressed. These effects may indicate that GS was no longer in crystalline state, however it is in amorphous state after entrapment within the polymer due to the fact that the drug crystals completely dissolve in the polymer matrix and the drug remained dispersed at molecular level in the solid dispersion after the formation of GS–Alg NPs [41, 42].
Furthermore, the thermogram of GS–Alg NPs suggest a depressed, broad exothermic peak at 237.21 °C compared with the Alg NPs, which can be due to a contribution of the dilution effect of GS and interpreted as an interaction among the drug (GS) and the NPs [43].
Also, by comparing endothermic peak of the GS–Alg NPs to Alg NPs, the former started at lower temperature 58.15 °C whilst Alg NPs showed a higher endothermic peak at 67.91 °C (curve (c)), that's a likely evidence of the presence of GS [39].
Consequently, the DSC results indicated signs of main chemical interaction among the drug and the polymer and confirmed that the crystallinity of the drug is reduced in the GS–Alg NPs [42].
4.4. Dielectric spectroscopy
The dielectric spectroscopy is considered as a vital tool in studding structural transitions and molecular mobility in polymers. The ability of the Alg NPs to form complex with GS become assessed using dielectric spectroscopy to determine the GS–Alg NPs interactions. The dielectric properties of Alg, GS as well as GS–Alg NPs were studied over a wide range of frequencies and temperatures through dielectric spectroscopy. The permittivity (ε') and the dielectric loss (ε'') had been measured within the frequency range 0.1 Hz–5 MHz and at temperatures starting from 30 °C up to 90 °C. The obtained data of ε' and ε'' versus the applied frequency  for Alg are illustrated graphically in figure 4.

Figure 4. Permittivity (ε') and dielectric loss (ε'') versus frequency  of Alg at different temperatures.
Download figure:
Standard image High-resolution imageFrom this figure it is clear that, the values of ε' and ε'' are very large at low frequency, however at higher frequencies they are enormously steady displaying an anomalous dispersion. In such range the permittivity has a contribution from orientation polarization. Similar behaviors were found in some polymers [44]. Such high values of ε' may be due to the interfacial effects in the bulk of the sample and the electrode effects [45]. When an electric field is applied to the materials, the long-variety float of ions and barrier layer formation on the electrode surface will result in large values of permittivity and dielectric loss [46]. But, at high frequencies, the periodic reversal of the electrical field takes place very speedy so the rotational motions of the polar molecules of Alg are not sufficiently speedy as that of the exchange inside the direction of electrical field. Therefore there is no extra ion diffusion within the course of the field and the polarization due to the charge accumulation decreases, leading to a decrease within the values of the permittivity with the frequency and reaches a constant value [47].
Also it is obvious that the values of ε' and ε'' increase with increasing the temperature because of the presence of polar groups and the amorphous nature of alginate. It has been recognized that, the variation of ε' and ε'' with temperature changes for non-polar and polar polymers. In general, for non-polar polymers, the values of ε' and ε'' are not based on the temperature, but in the case of polar polymers the dielectric permittivity will increase as the temperature increases because of the increase of the segmental mobility of the polymer molecules [44]. Consequently due to the fact that Alg polymer contains polar segments, the values of ε' and ε'' change significantly with temperature.
The dielectric loss (ε'') versus the frequency  curves of Alg, GS and GS–Alg NPs are represented in figure 5 at 30 °C and 90 °C. From this figure, it is found that the dielectric loss values of GS are lower than that of Alg therefore encapsulation of Alg NPs with GS have to lower their dielectric loss values as compared with Alg alone which indicating the successful encapsulation of Alg NPs with GS.

Figure 5. Dielectric loss (ε'') versus frequency  of Alg, GS–Alg NPs and GS at (a) 30 °C and (b) 90 °C.
Download figure:
Standard image High-resolution imageTo study the variation of dielectric loss (ε'') and conductivity (σ) with temperature, ε'' and σ are plotted at constant frequency (f = 10 Hz) and at different temperatures for Alg, GS, Alg NPs (figure 6). From this figure, it is discovered that the dielectric loss and the conductivity values of Alg are bigger than that of GS–Alg NPs. This means in the case of GS–Alg NPs, the mobility of ions reduced due to the interaction of Alg NPs with GS which leads to more compact structure and subsequently constrained (suppressed) the mobility of ions which suggests the successful encapsulation of Alg NPs with GS. Comparable results are obtained in which there is a decrease in the conductivity of Alg-cross linked films comparative to pure alginate after the interaction of alginate with calcium ions [24].

Figure 6. Variation of the dielectric loss (ε'') and conductivity (σ) at different temperatures (f = 10 Hz) for Alg, GS–Alg NPs and GS.
Download figure:
Standard image High-resolution image
Figure 7. The real part M' and imaginary part M'' of the electric modulus versus frequency f of GS–Alg NPs.
Download figure:
Standard image High-resolution imageThe curve relating ε'' and the applied frequency as shown in figure 4 are broader than single Debye curve indicating more than one relaxation time further to the dc conductivity. In an effort to limit the effect of conductivity and electrode polarization, the formalism of 'electric modulus' is added [44]:
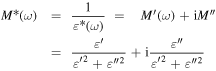
in which M' and M'' are the real and imaginary parts of electric modulus. The principle benefit of this formalism is that the space charge effects frequently do not mask the features of the spectra, owing to the suppression of high capacitance phenomena in M'' spectra therefore the electrode effect can suppressed. The acquired data for M' and M'' are illustrated graphically versus frequency in figure 7 for GS–Alg NPs. The almost zero values of M' at low frequency indicates the elimination of electrode polarization. From this figure, it can be seen that the curves concerning M'' and the frequency show the presence of two relaxation peaks.
The obtained data according to the electrical modulus formalism were analyzed at numerous temperatures in terms of two superimposed processes using Havriliak–Negami function through a pc program designed particularly for such purpose [48]. Examples of the analyses are illustrated graphically in figure 8 for Alg, GS–Alg NPs and GS respectively at 30 °C.

Figure 8. Example of the analysis for (a) Alg (b) GS–Alg NPs and (c) GS and respectively at 30 °C.
Download figure:
Standard image High-resolution imageIn the frequency range investigated in this work, the dielectric relaxation entails the dipolar (rotational) polarization, which depends on the molecular structure of the polymer. The first relaxation process (I) which located at lower frequencies range in Alg was fitted by Havriliak–Negami function and may be due to the beta relaxation which triggered by polar groups on the side chains [49]. This relaxation is associated with a dipole component including polar side chains of sodium Alg, namely carboxylate groups [COO–] [50].
According to Arrhenius equation, the activation energy corresponds to the first relaxation process (ΔH1) was calculated from the slope of the log relaxation time τI versus 1000/T [48]. For Alg, the activation energy corresponds to the first relaxation process (ΔH1) was observed to be 14.71 kJ mol−1, while for GS–Alg NPs, ΔH1 was found to be 18.40 kJ mol−1, as shown in figure 9. This means that higher activation energies have been acquired for GS–Alg NPs as compared to the unencapsulated particles. These outcomes seems to be the consequence of the ionic interactions occurred among the carboxyl groups (COO−) of Alg polymers with the amine groups (NH3+) of GS which make the chains of the Alg molecules more inflexible. Consequently, higher activation energy has been needed because the relaxation of these molecules are restricted and therefore large values of activation energy have been obtained in GS–Alg NPs in comparison to the unencapsulated ones which indicated the successful encapsulation of Alg NPs with GS.

Figure 9. Variation of log relaxation time of the first process (log τI) versus 1000/T for Alg and GS–Alg NPs.
Download figure:
Standard image High-resolution imageIt is also interesting to find that the peak of the first relaxation process (τI) that is detected in the lower frequency range is shifted towards lower frequency in the GS–Alg NPs in comparison to the unencapsulated ones. This indicated an increase within the relaxation time of this process and reflecting some sort of interaction occurred. This means the relaxation time of linear chained Alg molecules is shorter than that of GS–Alg NPs due to the decrease in mobility of the encapsulated NPs.
To understand the variation of the relaxation time of the first process, τI is plotted graphically for Alg and GS–Alg NPs in figure 10 at temperatures 30 °C–90 °C. From this figure, it is notable that τI increased for GS–Alg NPs than the unencapsulated particles. The increase in τI indicates an increase in the molar volume of the rotating unites due to the encapsulation of Alg NPs with GS and indicating an initiation of electrostatic interaction between the amine groups of GS and carboxyl groups of Alg NPs suggesting the successful encapsulation with GS.

Figure 10. Variation of the relaxation time of the first process (τI) for Gel and GS-Gel NPS at 30 °C–90 °C.
Download figure:
Standard image High-resolution image
5. Conclusion
In the present study, GS–Alg NPs have been successfully developed to be used for transdermal transport of GS. The TEM results indicated that the formulated GS–Alg NPs were found to be an effective carrier in terms of discrete particles and small nanometer particle size. FTIR spectrum of GS–Alg NPs confirmed a shift within the peak corresponding to C=O stretching vibration of Alg NPs toward lower wave numbers and within the peak corresponding to N–H bending vibration of GS toward higher wave numbers which can be attributed to an ionic interaction occurred among the carboxyl groups of Alg and the amino groups of GS suggesting the a successful encapsulation of GS. The DSC thermogram of GS–Alg NPs showed a shift in the endothermic peak of GS–Alg NPs to a lower temperature after the addition of GS and the endothermic peak that corresponding to the drug melting disappeared suggesting that the GS and Alg NPs has not been a simple admixture of the two additives however some type of chemical interaction took place among the drug and the polymer. Furthermore, the dielectric spectroscopy studies confirmed a decrease within the dielectric loss and conductivity values of GS–Alg NPs after the addition of GS. Additionally, higher activation energies and an increase in the relaxation time of the 1st process have been obtained after encapsulation of GS inside Alg NPs indicating an increase within the molar volume of the rotating unites and a decrease in the mobility of the GS-encapsulated NPs. Consequently the present work indicated signs of major chemical interaction between the drug (GS) and the polymer (Alg) which suggest the successful encapsulation of GS within the Alg NPs.