

Abstract
Silver nanoparticle (AgNP) has a wide range antibacterial effect and is extensively used in different aspects of medicine, food storage, household products, disinfectants, biomonitoring and environmental remediation etc. In the present study, we examined the growth inhibition effect of engineered silver nanoparticles against bloom forming cyanobacterial M. aeruginosa strain. AgNPs were synthesized by a chemical reduction method at room temperature and UV–Vis spectroscopy, scanning electron microscopy (SEM), transmission electron microscope (TEM) showed that they presented a maximum absorption at 410 nm and size range between 10 and 18 nm. M. aeruginosa cells exposed during 10 d to AgNPs to a range of concentrations from 0 to 1 mg l−1. The changes in cell density and morphology were used to measure the responses of the M. aeruginosa to AgNPs. The control and treatment units had a significant difference in terms of cell density and growth inhibition (p < 0.05). Increasing the concentration of AgNPs, a reduction of the cell growths in all treatment was observed. The inhibition efficiency was reached 98.7% at higher concentration of AgNPs nanoparticles. The term half maximal effective concentration (EC50) based on the cell growth measured by absorbance at 680 nm (A680) was 0.0075 mg l−1. The inhibition efficiency was 98.7% at high concentration of AgNPs (1 mg l−1). Image of SEM and TEM reflected a shrunk and damaged cell wall indicating toxicity of silver nanoparticles toward M. aeruginosa.
Export citation and abstract BibTeX RIS

Original content from this work may be used under the terms of the Creative Commons Attribution 3.0 licence. Any further distribution of this work must maintain attribution to the author(s) and the title of the work, journal citation and DOI.
1. Introduction
Nowadays, the occurrence of toxic cyanobacterial (CB) blooms in eutrophic freshwater, brackish and marine ecosystems is receiving increasing attention worldwide as a major ecological and potential health problem. Toxic cyanobacteria bloom may cause a multitude of water quality problems, including unpleasant odors, dissolved oxygen depletion, reduced water transparency and increased pH [1]. Furthermore, they can produce several potent toxins and the presence of these compounds in drinking and bathing water supplies poses a serious hazard to human health [2]. The control and management of algal bloom is important and thus there is great need for introduce efficient methods in order to minimize detrimental ecological and human health impacts of toxic CB bloom.
Silver has been used as a disinfectant since the times of the ancient Greeks because of its excellent antibacterial activity, low volatility, high stability, unlikelihood of microorganisms' developing resistance and nontoxicity to human cells [3–5]. Their antibacterial activities could be interpreted by the sorption of silver ions onto the negatively charged bacterial cell wall, causing deactivation of cellular enzymes, disruption of membrane permeability, leading to eventual cell lysis and death [6, 7]. Recently, many studies have shown that silver particles of nano-size caused the strong antibacterial effect because of high specific surface area [8, 9]. So, latter researches have been focused on the use of nanoparticles as an alternative to antibiotics and anti-algal due to their advantages over usual antimicrobial/algal and bacterial agents [10–13].
Methods of preparation of metal nanoparticles are quite diverse. Besides traditional methods of their production like mechanical milling, spray pyrolysis, chemical precipitation and vapor deposition [14], new methods based on chemical reduction of silver salts using various reducing agents have been developed last years [15–19]. These chemical methods have been mostly used for production of silver nanoparticle (AgNPs) because they provide an easy way to synthesize AgNPs in solution and control of particle size [20].
In this paper the nanosilver colloids were prepared by chemical reduced at room temperature and then characterized using UV–Vis spectroscopy, scanning electron microscopy (SEM), transmission electron microscopy (TEM). The anti-algal potential of engineered AgNPs on toxic bloom forming cyanobacteria was assessed. Microcystis aeruginosa (M. aeruginosa) strain was used to investigate growth inhibitory effect by engineered silver nanoparticles. Cell density, change in cell morphology, percentage of inhibition growth were employed to determine the toxic effect of AgNPs.
2. Experimental
2.1. Chemical synthesis and characterization of silver nanoparticles
The silver nanoparticles were synthesized by a chemical reduction method at room temperature (overall procedure showed in figure 1). Silver nitrate salt, AgNO3 (>99%) acted as the precursor for the formation of Ag nanoparticles was purchased from Merck Chemical Reagent Co. Sodium borohydride, NaBH4, of 98% purity used as the main reducing agent was purchased from Scharlab (Sentmenat, Barcelona, Spain). Chitosan (medium molecular weight) used as the stabilizing agent was purchased from Sigma-Aldrich. Citric acid, C6H8O7, purchased from Sigma-Aldrich will play two roles in this synthesis: as reducing agent, stabilizer and complexing agent with silver [21].

Figure 1. Overall procedure for preparing nanosilver colloid by chemical reduction method.
Download figure:
Standard image High-resolution imageIn this typical procedure for preparing 1 l of solution containing nano-silver (300 mg l−1), 0.473 g of AgNO3 was added to 1000 ml deionized water in a flask and vigorously stirred by IKA RW20 digital stirrer (Germany) at 1500 rpm for 15 min to dissolve the salt completely. Without disrupting stirring, 1.613 g of citric acid and 0.3 g chitosan were poured into the flask and the stirring was continued. 14 ml of NaBH4 solution (0.05 M) was then drop-wise added in solution under stirring for 15 min (figure 1). The silver nanoparticle colloid produced in this way were stored under dark conditions.
The formation of the colloidal silver nanoparticles was followed by using a UV–Vis spectrophotometer (Shimadzu 2450, Japan). Morphology and size of NPs were studied by SEM (FESEM, S4800-Hitachi, Japan) and transmission electron microscopy (TEM) (JEOL-JEM1010, Japan).
2.2. Cyanobacteria culture and experimental set up
The toxic CB M. aeruginosa was used as test organism in the present study. This strain was isolated from water bloom samples collected from the Ke-Go reservoir (central of Vietnam) using micropipette under an inverted microscope and in culture medium for cyanobacteria growth (CB medium). The CB culture was prepared in sterile CB medium having the following chemical ingredients (mg l−1):Ca(NO3)2.4H2O = 150 mg l−1; KNO3 = 100 mg l−1; MgSO4.7H2O = 40 mg l−1; 1-disodium glycerophosphate = 50 mg l−1; bicine = 500 mg l−1; biotin = 0.0001 mg l−1; vitamin B12 = 0.0001 mg l−1; and thiamine hydrochloride = 0.01 mg l−1 with 3 ml of PIV metals (micronutrients). PIV metals consisted of the following (calculation of mg/100 ml deionized water): FeCl3.6H2O = 19.6; MnCl2.4H2 = 3.6; ZnSO4.7H2O = 2.2; CoCl2.6H2O = 0.4; Na2MoO4.2H2O = 0.25; and EDTA.2H20 = 100. The pH of CB medium was 9.0 [22]. CB cells were maintained in CB medium in a culture room at 25 °C ± 1 °C under illumination at 1000 lux and 12/12 of light/dark regime.
In order to evaluate the effect of silver nanoparticle on growth of M. aeruginosa strain, 3 ml of CB suspension with exponential growth phase (5–6 d old) was harvested from stock cultures and was added to 150 ml of sterilized CB culture medium in glass jars (250 ml). M. aeruginosa cells were exposed to seven progressively increasing nominal concentration of silver nanoparticle including a control (0, 0.001, 0.005, 0.01, 0.05, 0.1 and 1 mg l−1). The experiment was performed in triplicate. Experiment was incubated under the same conditions (light, temperature) as mentioned above for 10 d. Prior to experiments, to avoid metal contamination all glassware used for the culture was previously cleaned with nitric acid, rinsed several times with deionized water. All materials were autoclaved (30 min at 121 °C and 1 atm) to prevent biological contamination. The samples were monitored at regular interval such as 0, 2, 6 and 10 d. 10 ml sample were collected in 15 ml Fisherbrand centrifuge tubes to observed CB growth by measuring optical density (OD) of culture suspension at 680 nm (OD A680) (Wetherell, 1961) and analyzed for cell density. Additionally, 10 ml of samples were taken for quantitative determination. Number of cells was counted directly by using a Neurbeur counting chamber under light microscope after dispersing the Microcystis cells by sonication.
The toxicity of AgNPs was expressed as percent cyanobacteria growth inhibition, calculated using the following formula

The experiments were carried out in replicates and results are presented as a mean ± standard error. All data analyzes were performed using GraphPad Prism software 6.
2.3. Observation of microcystis cells analysis
The cell surface of M. aeruginosa was observed with SEM (S-4800, HITACHI). After 24 h treatment with 1 mg L−1 AgNPs, M. aeruginosa cells were collected by centrifugation and fixed in mixture of 2% paraformaldehyde and 2.5% glutaraldehyde (GA) for 1 h, then washed with 0.1 M cacodylate buffer before post-fixing with 2% aqueous OsO4 in 0.2 M cacodylate buffer for 2 h. After washing with 0.1 M cacodylate buffer again, samples were dehydrated with increasing ethanol solutions (from 30% to 100% with 10% increments), dried using a critical point dryer (Emitech, K850, Quorum Technologies), and coated with Pt–Pd using ion sputter before SEM imaging. The elemental composition of visualized particles was analyzed by energy dispersive x-ray spectroscopy (EDX) attached to SEM. For TEM, M. aeruginosa cells exposure to AgNPs (1 mg l−1 after 24 h) were collected by centrifugation and fixed in a solution of 2.5% GA in 0.1 M cacodylate buffer, pH 7.4 and stored overnight at 4 °C. The sample was then rinsed carefully several times in 0.1 M cacodylate buffer pH 7.2; the final pellet was fixed with 1% OsO4 in the same buffer and subsequently dehydrated in graded ethanol (50%–100%) washed in propylene oxide and infiltrated for 6 h in a 1:1 mixture of propylene oxide and epoxidic resin (Epon). The samples were finally embedded in Epon 812. Thin 60–80 nm sections were obtained by ultra-173 microtome (Leica, UC6), using collodion coated copper grids (300 meshes). The analyzes of ultra-structural changes of interior of the M. aeruginosa cells were examined at 80 kV by TEM (JEM 1010, JEOL).
3. Result
3.1. Characterization of silver nanoparticles
Figure 2 shows the UV–Vis spectra, SEM and TEM images of nanosilver colloid prepared by chemical reduction method under the following optimum reaction parameters: AgNO3 = 473 mg l−1, chitosan = 300 mg l−1, citric acid = 1613 mg l−1, NaBH] = 2.7 mg l−1, NaBH4:AgNO3 = 1:4 and reductant drop rate is 10 drops min−1.

Figure 2. UV–Vis absorption spectrum of nanosilver colloid synthesized by chemical reduction method.
Download figure:
Standard image High-resolution imageUV–Vis spectroscopy was employed to monitor the formation of the silver nanoparticles. Nano-sized silver exhibits a strong absorption due to the collective oscillation of the conduction electrons, after appropriate excitation by suitable radiation. This phenomenon is known as localized surface plasmon resonance, which is highly dependent on the size and shape of the nanoparticles [23, 24]. The plasmon band of Chitosan-Ag colloid was observed at 400–450 nm (figure 2) which is consistent with other reports on different stabilizers [25, 26]. The fact that the surface plasmon absorption maximum was found with the wavelength around 410 nm confirmed the nanoessence of the manufactured silver particles (figure 2) [27, 28].
Figures 3(a) and (b) show the TEM images of nanosilver colloid. The TEM image (figure 3(b)) confirms that synthesized AgNPs are spherical in shape and have a smooth surface morphology. It is also apparent that resulting NPs are more and less uniform in size and shape. The TEM image (figure 3(a)) shows that AgNPs have a good size distribution with an average size of 10–15 nm.
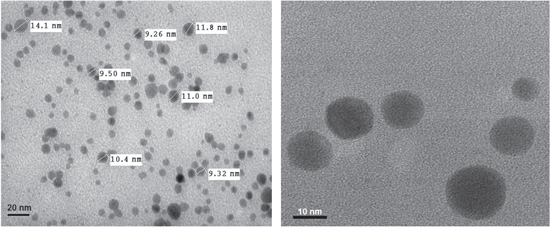
Figure 3. TEM images in different scale bar of nanosilver colloid synthesized by chemical reduction method.
Download figure:
Standard image High-resolution image3.2. Effect of AgNPs on cyanobacerial growth
M. aeruginosa, which is known as the most dominant toxic cyabacteria, is found in eutrophic water environments and they are common toxin producer and bloom-forming species. The use nanoparticles for algal growth control are a promising new technology for water remediation. In the present study, the use of AgNPs to control CB growth was investigated. In order to investigate the effects of AgNPs on Microcystis growth cells were exposed to a progressively increasing concentration of AgNPs from 0.001 to 1 mg l−1 for 10 d. Microcystis growths were estimated at day 0, 2, 6 and 10 of the exposure in the control and AgNPs treated. CB cell growths in term of OD A680 under different nanoparticle concentrations were plotted in figure 4. As illustrated by the growth curve, Ag-NPs synthesized by two methods were clearly toxic to M. aeruginosa strain. Microcystis cells decreased with increasing concentration of AgNPs up to 10 d. When increasing the concentration of AgNPs (0.005, 0.01, 0.05, 0.1 and 1 mg l−1) a reduction of the cell growths in all treatment were observed. High applied concentrations (0.1 and 1 mg l−1) were significant affected M. aeruginosa growth when compared with the other concentrations (p < 0.05).

Figure 4. Effect of different concentrations of silver nanoparticles on the growth of M. aeruginosa (data are mean ± standard deviation, n = 3).
Download figure:
Standard image High-resolution imageThese results demonstrated that are toxic to CB Microcystis. Recent studies have shown that AgNPs have a potential toxicity on various organisms including bacteria, algae, aquatic plants and zebra fish [29–33]. The toxicity of AgNPs to aquatic organism differ significantly depend on tested organism [33]. Among photosynthesis phytoplankton species, cyanobacteria (M. aeruginosa) was found to be more sensitive to AgNPs than other green algae [30].
Exposure to AgNPs caused high toxicity to Microcystis. The capacity of algae to resist the toxic action of toxicants could be estimated via its EC50 value. Indeed, EC50-10d based on the cell growth (A680) data was calculate and around 0.0075 mg l−1. The toxicity of AgNPs in the present study showed lower values than compared to other investigation reported in literature [34]. Citrate coated AgNPs caused the toxicity with EC50 values ranging from 0.19 [35] to 0.72 mg l−1 [36] based on algae Pseudokirchneriella subcapitata tests. Regarding Chlorella species the calculated EC50 values for growth inhibition was 0.89 mg l−1 [37]. Toxicity value for AgNPs varies greatly between aquatic algae species. This difference could be related to particle size and surface coating area of nanoparticles [29, 38] exposure conditions [39], cell wall membrane character [32], water chemistry [40]. In the present study the higher sensitivity of M. aeruginosa to AgNPs than other green algae reported in literature can be explained by differences in the structure of cell walls. M. aeruginosa are gram negative bacteria and their cell wall consists mainly of peptidoglycan, glycopeptides and mucopeptide whereas green algae cell wall consist mainly cellulose [30, 34]. Due to thin cell wall of cyanobacteria, the penetrations of silver nanoparticle into the cell get easier and silver possibly causes increases in cell membrane permeability leading to osmotic collapse [30]
The effects of AgNPs on the viability of cyanobacteria Microcystis strain during the 10 d of the experiment were also assessed by direct cell counting. The general pattern of cell density was similar to that obtain for cell growths in term of OD A680. The exposure of M. aeruginosa to AgNPs resulted in clear differences in cell number between controls and treated experiments. As shown in figure 5, at the control unit, the number of M. aeruginosa cells increased gradually from the beginning of the experiment (day 0 : 110 741 ± 6318 cells ml−1) and reached maximum value at the end of the experiment (day 10 : 5.4 × 10⁶ ± 541 274 cells ml−1). After exposure to 0.01–1 mg ml−1 concentrations of AgNPs the cell number were significantly lower in the treated units compared to that of control unit (p < 0.05).

Figure 5. Cell density of M. aeruginosa versus time at different concentrations of AgNPs: 0, 0.001, 0.005, 0.01, 0.05, 0.1 and 1 mg l−1 (data are mean ± standard deviation, n = 3).
Download figure:
Standard image High-resolution imageFrom these results, it could be seen that AgNPs caused a reduction of Microcystis cell viability. This was driven by the fact that cell density of Microcystis responsed negatively to the increase of nanosilver concentration. The results of our study are consistent with other studies that have suggested AgNPs can decrease the growth of some fresh algae species such as cyanobacteria Synechococcus species, M. aeruginosa, green algae Chlamydomonas reinhardtii, Chlorella vulgaris, Dunaliella tertiolecta [30–32, 38]. Release of Ag ions from silver nanoparticles has been described as determinant factor in toxicity to both fresh and marine algae [31, 32, 38]. The ability of algal cells to incorporate AgNP has been reported by Miao [41]. AgNPs could be taken in and accumulated within algal cells, where they were then able to exert their toxic effects.
The inhibition effects of AgNPs on the growth of M. aeruginosa after 10 d of exposure were evaluated and showed in figure 6. AgNPs synthesized by reduction method inhibited CB growths at five variables tested. The growth inhibition was significant increased with the increase of concentration of AgNPs. In fact, the growth inhibition of M. aeruginosa with the highest concentration (1 mg l−1) of NPs was higher than other AgNPs concentrations resulting in CB inhibition efficiency of 98.7% ± 0.37% on the day 10. Cell growth was inhibited by 18.2% ± 10%; 77% ± 2.2%; 97.7% ± 0.2% and 97.4% ± 0.1% when concentration AgNPs was 0.005; 0.01; 0.05 and 0.1 mg l−1, respectively.

Figure 6. Cyanobacterial inhibition efficiency (%) of AgNPs on growth M. aeruginosa (data are mean ± standard deviation, n = 3).
Download figure:
Standard image High-resolution imageOur results are in agreement with these previous studies. The similar effect was observed by data presented by Burchardt [31] which demonstrated that strong growth inhibition of diatom Thalassiosira pseudonana and cyanobacteria Synechococcus species were found after 24 h and 72 h of exposure respectively. Regarding the effects on growth of M. aeruginosa, at high concentrations (1 mg l−1) the percentage of growth inhibition was 87% [30].
In order to investigated morphological, cellular ultrastructure changes of M. aeruginosa, the cells were analyzed by using SEM-EDX and TEM after 2 d of exposure with AgNPs (1 mg l−1). As showed in figure 7(a), the M. aeruginosa without silver addition (control unit) maintained a round and had a spherical shape with a smooth exterior. After 48 h exposure with AgNPs the morphology structure of Microcystis was changed with a distorted and shrunk cell (figure 7(b)). This observation was also supported by the conclusion drawn by Chen [42] and Shirazi [43] those publications both prove that nanoparticles were highly toxic and caused change in morphology and dimensions of green algae Chlamydomonas reinhardtii and Dunaliella salina.

Figure 7. SEM images of Microcystis aeruginosa exposed to silver nanoparticle at 1 mg l−1 for 2 d. (a) M. aeruginosa cells in the absence of AgNPs and (b) M. aeruginosa cells after 2 d of exposure.
Download figure:
Standard image High-resolution imageSEM combined with EDX analysis was used to characterize the chemical composition and the location of AgNPs on cell surface. From EDX result, the energy spectrum of M. aeruginosa after exposure to a solution of 1 mg l−1 AgNPs was characterized by the appearance of 0.91% Ag by weight (figure 8) (data not showed). This result supports the hypothesis that the silver metals are attached to the CB cell wall.
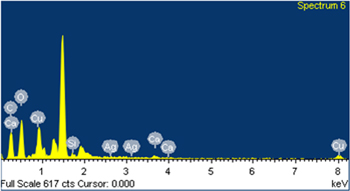
Figure 8. EDX spectrum of Microcystis aeruginosa biomass after 2 d of exposure with AgNPs of 1 mg l−1) confirmed the element composition of nanoparticles as silver.
Download figure:
Standard image High-resolution imageFigure 9(a) shows a healthy ultrastructural of M. aeruginosa and the cell has a neat shape with well delineated organist. However, under AgNPs exposure, significant cell surface disruption and damage to organelles was observed (figure 9(b)). These observations can regard as direct evidence to support the hypothesis that nanoparticle affect cells structure and AgNPs effect on the growth of M. aeruginosa by disrupting the cell wall. In other related studies [42, 44] it showed that C. reinhardtii cells under nanoparticles stress, their ultrastructural were damaged including the number of chloroplasts declined, degradation of organelles, plasmolysis occurred, cytomembrane breakage, and thylakoid disorder. Previous studies have also suggested that adsorption of nanoparticle to the cell surface and NPs located inside cell wall and plasmic membrane of algae could be altered the cellular acquisition of essential nutrients, either through clogging of the walls or nutrient adsorption [45] and activated to be more toxic to cells, leading to cell death [42, 46].

Figure 9. TEM images illustrating the ultrastructural changes caused by the exposure of M. aeruginsosa to the AgNPs at 1 mg l−1 after 2 d. (a) M. aeruginosa cell in the absence of AgNPs and (b) M. aeruginosa cell after 2 d of exposure.
Download figure:
Standard image High-resolution image
4. Conclusion
The silver nanoparticles were synthesized by a chemical reduction using silver nitrate salt acted as the precursor. The engineered silver nanoparticles exhibite a maximum absorption at 410 nm and size range between 10 and 15 nm confirmed by using UV–visible spectrophotometer, SEM and TEM. The data from the present study has shown the considerable toxicity of silver nanoparticle against the bloom forming CB M. aeruginosa strain as manifested by the strong decrease in cell growths (in term of OD A680) and viable algal cells. The inhibition efficiency ranged from 18.2% at lower concentration (0.005 mg l−1) and 98.7% at high concentration (1 mg l−1) of AgNPs nanoparticles. Toxic effects of AgNPs to cell morphology and ultrastructure could clearly be observed. Ag ions release from AgNPs contributed significantly to the toxic effect of silver nanoparticles on the CB M. aeruginosa. These results suggest that engineered silver nanoparticles may be employed to control the occurrence of CB blooms in freshwaters.
Acknowledgments
This study was realized in the framework of the VAST0701/15-16 (DTT) projects. The authors are grateful for the financial supports from Vietnam Academy of Science and Technology (VAST). The authors wish to acknowledge many individuals whose help and cooperation aided in the completion of this study.