

Abstract
This report describes the synthesis of metallic silver nanoparticles (AgNPs) using extracts of four medicinal plants (Aegle marmelos (A. marmelos), Alstonia scholaris (A. scholaris), Andrographis paniculata (A. paniculata) and Centella asiatica (C. asiatica)). The bio-conjugates were characterized by UV–visible spectroscopy, scanning electron microscopy-energy dispersive spectroscopy (SEM-EDS), Fourier transform infrared spectrometry (FTIR), x-ray diffraction (XRD) and zeta potential. This analysis confirmed that UV–Vis spectral peaks at 375 nm, 380 nm, 420 nm and 380 nm are corresponding to A. marmelos, A. scholaris, A. paniculata and C. asiatica mediated AgNPs, respectively. SEM images revealed that all the obtained four AgNPs are predominantly spherical, fibres and rectangle in shape with an average size of 36–97 nm. SEM-EDS and XRD analysis confirmed the presence of elemental AgNPs in crystalline form for all the four nanoparticle samples. The phytochemicals of various medicinal plant extracts with different functional groups were responsible for reduction of Ag+ to AgNPs, which act as capping and stabilizing agent. Among four types of AgNPs tested for anticancer activity, the Ap mediated AgNPs had shown enhanced activity against HepG2 cells (27.01 µg ml−1) and PC3 cells (32.15 µg ml−1).
Export citation and abstract BibTeX RIS

Original content from this work may be used under the terms of the Creative Commons Attribution 3.0 licence. Any further distribution of this work must maintain attribution to the author(s) and the title of the work, journal citation and DOI.
1. Introduction
Metal based novel nanoparticles or nanomaterials are now attracting interest for various applications in medicine, biotechnology, nanofertilizer and nanomedicine. However, only a few nano products raised from metal are currently in use for medical purposes, with silver nanoparticles being the most promising product to date [1–3]. AgNPs have a great potential in cancer management because it is selectively involved in disruption of the mitochondrial respiratory chain by AgNPs leading to production of reactive oxygen species (ROS) and interruption of adenosine triphosphate (ATP) synthesis, which intern cause DNA damage [4, 5]. Liver cancer is the fifth most frequently diagnosed cancer and the third leading cause of cancer related death in the world [6]. About 35 660 new cases of liver cancer (including intrahepatic bile duct cancers) occurred in the US during 2015, approximately three-fourths of which will be hepatocellular carcinoma (HCC). Liver cancer incidence rates are about three times higher in men than in women. An estimated 24 550 liver cancer deaths (7520 women, 17 030 men) are expected in 2015 [7]. Therefore, the availability of large quantity of stable nanoparticles is one of the prerequisites to meet the future pharmaceutical industry demand for cancer treatment. On this basis we have studied the anticancer activity of AgNPs obtained from four medicinal plant extracts as a low cost, rapid, simple and eco-friendly mode.
Chavan et al [8] reported that methanolic leaf extracts of Andrographis paniculata (A. paniculata) and ethanolic leaf extracts of Aegle marmelos (A. marmelos) showed anticancer activity on A549 cell lines, and Pittella et al [9] demonstrated cytotoxic potential of methanolic extracts of Centella asiatica (C. asiatica) leaves against MDA-MB-231 cells. Thankamani et al [10] recorded the anticancer activity of methanolic extracts of Alstonia scholaris (A. scholaris) roots against L929 cancer cell lines. Kandouz et al [11] described that prostate cancer cell growth was inhibited by aqueous extracts of Teucrium polium. Methanolic extracts of Gracilaria corticata had significant anticancer activity on HepG2 cell lines [12]. Though various plant extracts have been tested for their anticancer activity, no reports are currently available on the cytotoxic effect of biosynthesized silver nanoparticles using A. scholaris, A. paniculata, A. marmelos, C. asiatica plant extracts against human liver (HepG2) and human prostate (PC3) cancer cells. The current research is worldwide mainly focused to study the cytotoxic effects of synthesized AgNPs against human cancer cell lines. The cytotoxic effect of biosynthesized AgNPs on various cancer cell lines were reported earlier in [13–19]. Various bioactivities of phenolic compounds present in medicinal plants are mainly responsible for their chemopreventive properties (e.g. antioxidant, anticarcinogenic, or antimutagenic and anti-inflammatory effects) and also contribute for inducing apoptosis by arresting cell cycle, regulating carcinogen metabolism and ontogenesis expression, inhibiting DNA binding and cell adhesion, migration, proliferation or differentiation, and blocking signaling pathways [20].
To find new herbal compounds based nanodrug for anticancer efficacy, the present study is focused to phytosynthesize and characterize the AgNPs using aqueous leaf extracts of four selected medicinal plants. In addition, the silver nanoparticles were evaluated for their cytotoxic potential against two cancer cell lines, namely human liver (HepG2) and human prostate (PC3) cells.
2. Experimental
2.1. Plant materials and preparation of the aqueous extracts
Leaves of A. scholaris (Apocynaceae), A. paniculata (Acanthaceae), A. marmelos (Rutaceae) and C. asiatica (Apiaceae) were collected freshly from Biodiversity Garden, Periyar University, Salem, and they were washed thoroughly with copious amount of deionized water, shade dried for 2–3 weeks and powdered. Each individual plant sample (5 g) was boiled in 50 ml of deionized water at 60 °C for 15 min. After cooling the mixtures were filtered through whatman no.1 filter paper and the filtrates were used for further experiments.
2.2. Synthesis of silver nanoparticles
Leaf extract mediated synthesis of silver nanoparticles (AgNPs) was carried out according to Velmurugan et al [21]. In brief, 90 ml of 1 mM aqueous silver nitrate (Sigma-Aldrich, St. Louis, MO, USA) solution was added to 10 ml of each prepared leaf extract individually by fine shaking and incubated overnight at room temperature in the dark. The initial AgNPs formation was confirmed by colour change. On completion of the synthesis, the reaction mixture was centrifuged at 8000 × g for 10 min and the nanoparticle pellet was dissolved in sterile distilled water and washed thrice by centrifugation to remove impurities.
2.3. Characterization of silver nanoparticles
A UV–Vis spectrophotometer (UV-1800-Shimadzu, Kyoto, Japan) was operated at 1 nm resolution within a working wavelength range of 300–700 nm using a dual beam. X-ray powder diffraction (XRD) of the samples was performed using a Rigaku x-ray diffractometer (Rigaku, Japan), with scanning done in the region of 2θ from 2θ = 20 to 80° at 0.04° min−1 with a time constant of 2 s. Fourier transform infrared spectroscopy (FTIR) spectra of the AgNPs were obtained with a Perkin-Elmer FTIR spectrophotometer (Norwalk, CT, USA) in diffuse reflectance mode at a resolution of 4 cm−1 in KBr pellets. Scanning electron microscopy—energy dispersive spectroscopy (SEM-EDS) spectra was conducted (SEM, JEOL-JSM 6390, Japan) to examine the surface morphology and to record the spot-profile mode by focusing the electron beam and also to confirm the elemental composition of the samples. The particle size distribution of AgNPs was evaluated using dynamic light scattering (DLS) measurements and zeta potential analysis was conducted with a zetasizer nanoseries compact scattering spectrometer (Malvern Instruments Ltd, UK).
2.4. Cell lines and culture medium
The cell lines namely HepG2 (human liver cancer), PC3 (human prostate cancer) and Vero (African monkey kidney) were obtained from the National Centre for Cell Sciences (NCCS), Pune, India. The cells were maintained in Dulbecco's modified Eagle's medium (DMEM) and Eagle's minimal essential medium (EMEM), supplemented with 2 mM L-glutamine, and balanced salt solution (BSS) and adjusted to contain 1.5 g l−1 sodium carbonate, 0.1 mM non-essential amino acids, 1 mM sodium pyruvate, 2 mM L-glutamine, 1.5 g l−1 glucose, 10 mM 4-(2-hydroxyethyl)-1-piperazineethane sulfonic acid (HEPES) and 10% fetal bovine serum (GIBCO, USA). Penicillin and streptomycin (1 IU µg−1) were added at 1 ml l−1. The cells were maintained in 25 cm2 culture flask (Corning, USA) at 37 °C with 5% CO2 in a humidified CO2 incubator.
2.5. In vitro cytotoxicity and determination of IC50
The 50% inhibitory concentration (IC50) value was determined using 3-(4,5-dimethylthiazol-2-yl)-2,5-diphenyltetrazolium bromide (MTT) assay carried out according to the method of Priyadharshini et al [22]. Cells were cultured and ~1 × 10⁴ cells/well were seeded into 96-well culture plates and incubated for 48 h. Cell lines viz., HepG2, PC3 and Vero cells were treated with series of concentrations (1–100 µg ml−1) of A. marmelos, A. paniculata, A. scholaris and C. asiatica AgNPs and 5-FU. The NPs treated cells were incubated for 48 h to study the cytotoxicity by using MTT assay. The MTT (Himedia) stock (5 µg ml−1) was prepared and the culture medium was removed and MTT solution (100 µl) was added in each AgNPs treated and control well that were incubated for 4–6 h at 37 °C. Cell viability assay was performed by the conversion of the tetrazolium salt (MTT) to a purple colour formation by the mitochondrial dehydrogenases and these crystals were dissolved in 100 µl of dimethyl sulphoxide (DMSO) and absorbance was measured at 620 nm in a multi well ELISA plate reader (Thermo Multiskan EX, USA). The optical density (OD) value was used to calculate the percentage of cell viability by using the following formula
2.6. Morphological study
PC3 and HepG2 cells that were grown on cover slips (1 × 10⁵ cells/cover slip) were incubated with A. marmelos, A. paniculata, A. scholaris and C. asiatica AgNPs at IC50 concentration, and they were fixed in ethanol:acetic acid mixture (3:1, v/v). The cover slips were gently mounted on glass slides for the morphological changes. The morphological changes of PC3 and HepG2 cells were analyzed using bright field inverted microscopy (Nikon, Japan) at 40× magnification [23].
2.7. Acridine orange (AO) and ethidium bromide (EtBr) staining
Both PC3 and HepG2 cells were seeded in 24 well plate (1 × 10⁵ cells ml−1) and treated with A. marmelos, A. paniculata, A. scholaris and C. asiatica AgNPs at IC50 concentration for 48 h at 37 °C. The AgNPs treated cancer cells were collected washed with phosphate buffered saline (PBS; pH 7.2). For staining, 1 µl of AO/EtBr dye mixture 10 mg ml−1 of acridine orange (AO) and 10 mg ml−1 ethidium bromide (EtBr) in PBS was added into 9 µl of cell suspension (1 × 10⁵ cells ml−1) on clean microscopic cover slips. After incubation for 2–3 min, the cells were visualized under a Fluorescence microscope (Nikon Eclipse, Inc., Japan) at 40× magnification with an excitation filter set at 510–590 nm. Percentage of apoptotic cells was determined according to the following formula

2.8. Rhodamine 123 staining
Cancer cell lines (PC3 and HepG2) were seeded and treated with A. marmelos, A. paniculata, A. scholaris and C. asiatica AgNPs for 48 h in a 6-well plate (Nunc), and then fixed with 500 µl of methanol and kept for drying, prior to washing with PBS and 500 µl of 4% (v/v) formaldehyde for 20 min. The washed cells were then stained with 100 µg ml−1 of rhodamine-123 (Sigma, USA) for 20 min in the dark at room temperature. Stained images were captured using fluorescent microscope (Zeiss) with appropriate excitation filter.
2.9. Nuclear morphology assay
Cell lines (PC3 and HepG2) were seeded in a 6-well plate (Nunc) and treated with A. marmelos, A. paniculata, A. scholaris and C. asiatica AgNPs for 48 h. The cells were washed with PBS and then fixed in 500 µl of methanol and 500 µl of 4% (v/v) formaldehyde for 20 min and kept for drying at room temperature. Cells were then stained with 100 µg ml−1 of HOECHST-33258 (Sigma, USA) for 10 min in the dark at room temperature. Hoechst-stained nuclei images were recorded under fluorescent microscope (ZEISS) using appropriate excitation filter.
2.10. DNA fragmentation assay
Cell lines of PC3 and HepG2 (1 × 10⁶ cells) were exposed to IC50 concentration of AgNPs for 48 h and were gently scraped and harvested by centrifugation. Cells were then suspended in 10 ml of TE buffer solution (10 mM tris-HCl, 1 mM ethylenediaminetetraacetic acid (EDTA) pH 8.0, 2% sodium dodecyl sulfate (SDS), and 20 mg ml−1 proteinase K). The mixture was incubated at 37 °C for 3 h, followed by DNA extraction with a phenol:chloroform:isoamyl alcohol (25:24:1) solution. The DNA was treated with DNase-free RNase at a concentration of 20 mg ml−1 at 37 °C for 30 min and precipitated with 1/10 volume of 2.5 M sodium acetate (pH 7.0) and three volumes of 100% ethanol. DNA fragmentation analysis was carried out with 10 µl of DNA prepared from IC50 concentration of AgNPs treated cells and analyzed using 1.5% (w/v) agarose gel containing ethidium bromide.
2.11. Statistical analysis
All data were used for statistical analysis with three replicates and expressed as mean ± S.D. A probability level of P < 0.05 was used for the significance of differences between mean values. Data were analyzed using GraphPad InStat and Prism version 3.00 for Windows, GraphPad Software, San Diego, CA, USA.
3. Results and discussion
3.1. Green synthesis and characterization of AgNPs
The reduction of pure Ag+ ions to Ag0 was monitored based on a visual colour change (from light yellow to brown), and the UV–visible absorbance of the reaction mixture show a strong intense peaks for A. marmelos (375 nm), A. scholaris (380 nm), A. paniculata (420 nm) and C. asiatica (380 nm) (figure 1) during 3 h incubation period. The colour change of the reaction mixture occurs due to the excitation of surface plasmon vibrations. Mukherjee et al [24] and Velmurugan et al [25] reported that the reduction process of Ag+ to Ag0 nanoparticles occurred possibly due to the presence of nicotinamide adenine dinucleotide phosphate (NADPH)-dependent dehydrogenase enzyme and phytochemical compounds including phenolic groups in the plant extracts. The presence of various phytochemicals in the plant extracts could be responsible for the reduction of Ag+.
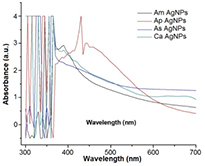
Figure 1. UV–Vis spectral analysis of synthesized AgNPs using aqueous extracts of Aegle marmelos (Am), Andrographis paniculata (Ap), Alstonia scholaris (As) and Centella asiatica (Ca).
Download figure:
Standard image High-resolution imageThe FTIR spectra of A. marmelos, A. paniculata, A. scholaris and C. asiatica aqueous leaf extracts and their respective AgNPs are depicted in figure 2. The major peaks of aqueous leaf extracts exhibit various wave numbers that correspond to different functional groups and were observed between 3353–616 cm−1, 3407–653 cm−1, 3404–654 cm−1 and 3342–697 cm−1 for A. marmelos, A. scholaris, A. paniculata and C. asiatica, respectively (figure 2(a)). A strong peaks at 3407 and 3404 cm−1 represents N–H stretching amines group, 2935 cm−1 corresponds to C–H stretching alkanes group, 2368 and 2363 cm−1 represents primary amines, 2155 and 2136 cm−1 corresponds to terminal alkynes of (C ≡ C) C–C bond groups, 1574, 1591 and 1590 cm−1 corresponds to N–H bends of amines groups, 1399 cm−1 represents C–H in-plane bend with alkenes group, 1124 and 1122 cm−1 corresponds to C–C stretching anhydrides group, 826 and 830 cm−1 corresponds to P–H bend phosphines group, 697 and 700 cm−1 corresponds to the C–H bend of mono aromatics ring groups, 616 cm−1 represents acetylenic C–H bend with alkynes groups respectively. The synthesized AgNPs show intense peaks at 3427–668 cm−1 A. marmelos, 3446–607 cm−1 A. paniculata, 3441–602 cm−1 A. scholaris and 3424–669 cm−1 C. asiatica (figure 2(b)). Peaks at 3446 and 3427 cm−1 corresponds to N–H stretch (amines), 2921 and 2914 cm−1 associated with C–H stretch (alkanes), 2852 cm−1 represents to C–H stretch (aldehydes), 2339 cm−1 corresponds to P–H stretch (phosphines), 1633 cm−1 indicates the C = C stretch (alkenes), 1629 cm−1 linked to nitro groups (aliphatic), 1383 cm−1 corresponds to C–H in plane bend stretching alkenes group, 1265 and 1255 cm−1 corresponds to acetyl group (ethers), 1236 cm−1 represents to C–O stretch (carboxylic acids), 1092 cm−1 corresponds to ethers (C–O–C dialkyl), 1030 cm−1 represents C–N of aliphatic amines, 803 cm−1 indicates the aromatics (C–H bend), 668 cm−1 corresponds to alkenes group, 607 cm−1 represents alkyl halides.
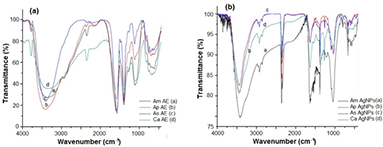
Figure 2. FTIR spectral analysis of (a) aqueous extracts (AE) and (b) biosynthesized silver nanoparticles (AgNPs) of A. marmelos (Am), A. paniculata (Ap), A. scholaris (As) and C. asiatica (Ca).
Download figure:
Standard image High-resolution imageSEM images of A. marmelos, A. paniculata, A. scholaris and C. asiatica AgNPs are depicted in figures 3(a)–(d), respectively; and their EDS spectra are shown in figures 4(a)–(d), respectively. The SEM images reveal that all types of NPs were found to be various shapes such as fibrous, rectangle and spherical with smooth edges (figures 3(a)–(d)), and the size of the nanocomplex was ranged from 37–79 nm, 36–65 nm, 53–94 nm and 49–97 nm for A. marmelos, A. paniculata, A. scholaris and C. asiatica AgNPs, respectively. The EDS image of AgNPs showed strong silver metal peaks in the range between 2–4 keV and it showed weak signals of silicon, chlorine and oxygen which confirmed the pure elemental form of the synthesized AgNPs (figures 4(a)–(d)). Similar findings on SEM and EDS spectrum analysis were reported for synthesized AgNPs using leaf extracts of Artemisia nilagirica [26], Ficus benghalensis [27], Rauvolfia tetraphylla [28], Caesalpinia coriaria [29] and Naringi crenulata [30].
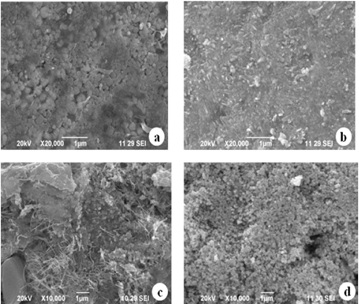
Figure 3. SEM images of synthesized AgNPs using (a) A. marmelos, (b) A. paniculata, (c) A. scholaris and (d) C. asiatica extracts confirming the spherical and fibre shaped nanocrystals.
Download figure:
Standard image High-resolution image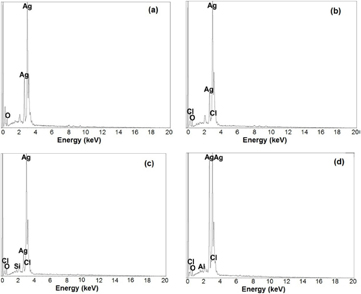
Figure 4. Energy dispersive x-ray (EDS) spectroscopy of AgNPs exhibited the strong signal of silver from (a) AmAgNPs, (b) ApAgNPs, (c) AsAgNPs and (d) CaAgNPs. Note: A. marmelos (Am), A. paniculata (Ap), A. scholaris (As) and C. asiatica (Ca).
Download figure:
Standard image High-resolution imageThe XRD patterns of the A. marmelos, A. paniculata, A. scholaris and C. asiatica AgNPs are shown in figures 5(a)–(d), respectively. The diffraction peaks at 2θ values of 32.12°, 38.41°, 44.22°, 46.22°, 54.94°, 64.38° and 77.36° corresponding to the (1 2 2), (1 1 1), (2 0 0), (2 3 1), (1 4 2), (2 2 0) and (3 1 1) planes; for A. marmelos, A. paniculata peaks at 2θ = 38.31°, 44.60°, 64.75° and 77.49° corresponding to (1 1 1), (2 0 0), (2 2 0), (3 1 1) planes, C. asiatica peaks at 2θ = 32.28°, 38.25°, 46.28°, 54.83°, 64.56°, 77.69° corresponding to (1 2 2), (1 1 1), (2 3 1), (1 4 2), (2 2 0), (3 1 1) planes, and A. scholaris peaks at 2θ = 38.25°, 44.62°, 64.56°, 77.26° corresponding to the (1 1 1), (2 0 0), (2 2 0), (3 1 1) sets of lattice planes and it indicates the face-centred cubic (fcc) structure of AgNPs, which are closely linked with Joint committee on powder diffraction standards (JCPDS file no. 04-0783) for silver. Our XRD diffraction is consistent with Jeeva et al [29], and Jayaseelan and Rahuman [31] for synthesis of AgNPs using aqueous leaf extracts of C. coriaria and Ocimum canum. Similar results were reported by Selvi et al [19] using Padina tetrastromatica seaweed extract.

Figure 5. XRD patterns of biosynthesized silver nanoparticles (a) A. marmelos AgNPs, (b) A. paniculata AgNPs, (c) A. scholaris AgNPs and (d) C. asiatica AgNPs exhibiting the facets of crystalline silver.
Download figure:
Standard image High-resolution imageAgNPs dispersed in millipore water were highly stable with a zeta (ζ) potential value of −14.9 mV, –20.9 mV, –3.93 mV and –29.8 mV for A. marmelos AgNPs, A. paniculata AgNPs, A. scholaris AgNPs and C. asiatica AgNPs, respectively (table 1). Kumar et al [32] and Sukirtha et al [14] reported similar zeta potential values for AgNPs synthesized using G. corticata and Melia azedarach extracts in a well accordance with present results. DLS analysis showed the size distribution of silver nanoparticles with maximum intensity at 70, 80, 60 and 90 nm for A. marmelos AgNPs, A. paniculata AgNPs, A. scholaris AgNPs and C. asiatica AgNPs, respectively (table 1).
Table 1. Zeta potential and particle size determination of biosynthesized AgNPs from Aegle marmelos, Alstonia scholaris, Andrographis paniculata and Centella asiatica extracts.
| Biosynthesized AgNPs | Zeta potential value (mV) | Particle size (nm) |
|---|---|---|
| A. marmelos AgNPs | −14.9 | 70 |
| A. paniculata AgNPs | −3.93 | 60 |
| A. scholaris AgNPs | −20.9 | 80 |
| C. asiatica AgNPs | −29.8 | 90 |
3.2. Detection of cytotoxicity assay
The 3-(4, 5-dimethylthiazol-2-yl)-2, 5-diphenyltetrazolium bromide (MTT) assay was carried out to determine the in vitro cytotoxic effect of the synthesized A. marmelos AgNPs, A. paniculata AgNPs, A. scholaris AgNPs and C. asiatica AgNPs. Both HepG2 and PC3 cancer cell lines were treated with different concentrations ranging from 1–100 µg ml−1 for 48 h with A. marmelos AgNPs, A. paniculata AgNPs, A. scholaris AgNPs and C. asiatica AgNPs, whereas, the Vero cell lines were treated with various doses ranging from 10–100 µg ml−1 for 48 h. The percent of growth inhibition by cell viability of NPs treated cancer cells along with untreated control cells are depicted in figure 6. The cell line cytotoxicity was found to be NPs concentration dependent. The cell viability was also decreased with increasing the concentrations of the four biosynthesized NPs. The IC50 value was calculated using the MTT assay. The inhibitory concentration (IC50) values of the HepG2 cells and PC3 cells were 75.68, 27.01, 43.76 and 40.32 µg ml−1; and 54.68, 32.15, 53.16 and 52.99 µg ml−1 for A. marmelos AgNPs, A. paniculata AgNPs, A. scholaris AgNPs and C. asiatica AgNPs, respectively (figures 6(a) and (b)). In this study A. paniculata AgNPs and C. asiatica AgNPs showed higher cytotoxicity at 27.01, 40.32 and 32.15, 52.99 µg ml−1 for HepG2 and PC3 cell lines, respectively. A. marmelos AgNPs exhibited significant anticancer activity at 75.68 and 54.68 µg ml−1 for HepG2 and PC3 cell lines, respectively. A. scholaris AgNPs showed efficient cytotoxicity against HepG2 and PC3 cells for 43.76 and 53.16 µg ml−1 doses, respectively. Chavan et al [8] reported that methanolic leaf extracts of A. paniculata and ethanolic leaf extracts of A. marmelos showed anticancer activity against A549 cell lines at 60 µg ml−1 and 30 µg ml−1 doses, respectively. Pittella et al [9] reported that methanolic extracts of C. asiatica leaves showed cytotoxic effect on MDA-MB-231 cells at 648 µg ml−1 dose. Thankamani et al [10] reported that methanolic extracts of A. scholaris roots showed anticancer activity on L929 cells. In the present study, four types of silver nanoparticles namely A. marmelos AgNPs, A. paniculata AgNPs, A. scholaris AgNPs and C. asiatica AgNPs were tested for their cytotoxic activity against two cancer cell lines (HepG2 and PC3). It is interesting to note that due to the presence of diterpenoids in A. paniculata AgNPs, it showed effective cytotoxic activity against HepG2 and PC3 cell lines followed by C. asiatica AgNPs, A. paniculata AgNPs and A. marmelos AgNPs. The IC50 values for Vero cell lines were found to be 91.20, 69.99, 55.23, 54.87 µg ml−1 for A. marmelos AgNPs, A. paniculata AgNPs, A. scholaris AgNPs and C. asiatica AgNPs, respectively (figure 6(c)). The AgNPs at lower doses had less cytotoxicity on the growth of normal cell lines (Vero), but enhanced cytotoxicity was observed with increasing the doses. The IC50 values of PC3, HepG2 and Vero cell lines were found to be 3.756, 2.521 and 18.15 µg ml−1 for using positive drug 5-fluorouracil (5-FU). The mortality data obtained in this study allowed us to predict that the green synthesised AgNPs are potential anticancer molecules/drugs to act as cytotoxic agents. The cytotoxic effects of AgNPs had indicated the occurrence of active physicochemical interaction of silver atoms with the functional groups of intracellular proteins, as well as with the nitrogen bases and phosphate groups in DNA [33].
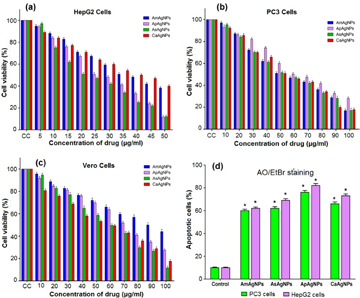
Figure 6. MTT assay confirming the cytotoxic effect of AgNPs against the PC3, HepG2 cells and the normal Vero cells for 48 h respectively. (a) Cytotoxic effects of synthesized silver nanoparticles on human liver cancer (HepG2), (b) prostate cancer (PC3) and (c) normal kidney cell line (Vero) for AmAgNPs, ApAgNPs, AsAgNPs and CaAgNPs respectively. (d) Apoptotic cells observed at IC50 concentration of AgNPs treated against PC3 and HepG2 cancer cells after 48 h treatment. Data were expressed as mean ± SD (three replicates). Values are statistically significant at P < 0.05 level. Note: A. marmelos (Am), A. paniculata (Ap), A. scholaris (As) and C. asiatica (Ca).
Download figure:
Standard image High-resolution image3.3. Morphological analysis
The morphological changes were observed in A. marmelos AgNPs, A. paniculata AgNPs, A. scholaris AgNPs and C. asiatica AgNPs treated HepG2 and PC3 cells over untreated control cells. The most recognizable morphological changes due to the AgNPs exposure were the cytoplasmic condensation, cell shrinkage, production of numerous cell surface bulged at the plasma membrane and aggregation of the nuclear chromatin into dense masses under the nuclear membrane against HepG2 (figures 7(a)–(e)) and PC3 (figures 8(a)–(e)) cells. Their membrane also became warped and vesicle shaped. AgNPs treatment resulted in swelling and rounded morphology of both cells with condensed chromatin. Progressive structural modification and reduction of HepG2 and PC3 cell populations were also observed. Similarly, Vivek et al [34] also observed cytotoxicity of silver nanoparticles synthesized using Annona squamosa leaf extracts against MCF-7 cells.

Figure 7. Bright field and fluorescence microscopy images of IC50 concentration of silver nanoparticles treated on HepG2 cells and incubated at 37 °C for 48 h. Cytotoxicity observed from bright field microscope: (a) HepG2 control (untreated) cells, (b) CaAgNPs, (c) AsAgNPs, (d) ApAgNPs and (e) AmAgNPs treated cells. Fluorescence microscopy study of AO/EtBr stained respective control and treated HepG2 cells: (f) control (untreated) cells, (g) CaAgNPs, (h) AsAgNPs, (i) ApAgNPs and (j) AmAgNPs treated cells. The cell lines in green colour, orange colour and red colour denoted by the arrows are live cells, proapoptotic cells and dead cells respectively. Rhodamine mitochondrial staining and Hoechst nuclear staining of untreated cells (k) and (p) and AgNPs treated cells exhibited condensed form of mitochondrial (l)–(o) and nuclear materials in apoptotic cells (q)–(t). The scale bars are 20 µm. Note: A. marmelos (Am), A. paniculata (Ap), A. scholaris (As) and C. asiatica (Ca).
Download figure:
Standard image High-resolution image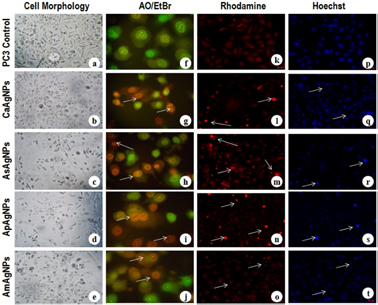
Figure 8. Light and fluorescence microscopy images of silver nanoparticles (IC50 concentration) treated PC3 cells and incubated at 37 °C for 48 h. Cytotoxicity observed from bright field microscope: (a) PC3 control (untreated) cells, (b) CaAgNPs, (c) AsAgNPs, (d) ApAgNPs and (e) AmAgNPs treated cells. Fluorescence microscopy study of AO/EtBr stained respective control and treated PC3 cells: (f) control (untreated) cells, (g) CaAgNPs, (h) AsAgNPs, (i) ApAgNPs and (j) AmAgNPs treated cells. The cell lines in green colour, orange colour and red colour denoted by the arrows are live cells, proapoptotic cells and dead cells respectively. Rhodamine mitochondrial staining and Hoechst nuclear staining of control (untreated) cells (k) and (p) and AgNPs treated cells exhibited condensed form of mitochondrial membrane (l)–(o) and nuclear materials in apoptotic cells (q)–(t). The scale bars are 20 µm. Note: A. marmelos (Am), A. paniculata (Ap), A. scholaris (As) and C. asiatica (Ca).
Download figure:
Standard image High-resolution image3.4. Detection of apoptotic cells by AO/EtBr staining assay
The induction of apoptosis plays an important role in the drug development. Commercially available anticancer drugs have shown to induce apoptosis in susceptible (cancer) cells. The morphology of the necrotic, apoptotic and normal cells of both HepG2 and PC3 cells were identified separately using fluorescence microscopy after staining with acridine orange/ethidium bromide (AO/EtBr) based on the cell membrane integrity. The HepG2 and PC3 cells exhibited green fluorescence colour that expresses the presence of viable cells in untreated controls. After exposure to nanoparticles, the percent of apoptotic cells was calculated with their respective control cells. Red necrotic cells, as well as orange apoptotic cells containing apoptotic bodies were also noticed in the AgNPs treated HepG2 (figures 7(f)–(j)) and PC3 (figures 8(f)–(j)) cells. Microscopic observation showed that the normal viable cells were appeared to be green fluorescence because of the diffusion of acridine orange (AO) into cell membrane, whereas, apoptotic cells were observed as orange colored bodies due to the nuclear shrinkage and blebbing. However, the necrotic cells were turned into red color fluorescence due to their loss of membrane integrity by AgNPs induced cytotoxicity. It was observed that the total number of apoptotic cells increased when the cells were treated with their IC50 concentrations of AgNPs compared to the respective controls. The percent of apoptotic bodies recorded was 58, 82, 68, and 73% against HepG2 cells, and 60, 76, 62 and 66% against PC3 cells for A. marmelos AgNPs, A. paniculata AgNPs, A. scholaris AgNPs and C. asiatica AgNPs, respectively, over control cells (figure 6(d)). Similarly, Kalaiarasi et al [17] reported that bio-fabricated silver nanoparticles using leaf extracts of bamboo had induced apoptosis in human PC3 cell lines. Most recently, Selvi et al [19] also reported that AgNPs synthesized using P. tetrastromatica seaweed extracts could induce apoptosis in human breast cancer (MCF-7) cell lines.
3.5. Mitochondrial membrane potential
In order to confirm the apoptosis, rhodamine 123 staining was performed on HepG2 and PC3 cell lines that were treated with the A. marmelos AgNPs, A. paniculata AgNPs, A. scholaris AgNPs and C. asiatica AgNPs for 48 h. Silver nanoparticles treated cancer cell lines exhibited bright pink colour emission indicted the mitochondrial fragmentation which leads to the initiation of apoptosis. Interestingly, the control/untreated cells had shown intact mitochondria with normal morphology which emitted a weak pink fluorescence for HepG2 (figures 7(k)–(o)) and PC3 (figures 8(k)–(o)) cells. Wenjuan et al [35] reported that the exposure of nanoparticles had increased the levels of reactive oxygen species (ROS) generation which ultimately decreased the mitochondrial membrane potential leads to cell death.
3.6. Nuclear morphology assay
As seen in figures 7 and 8, the Hoechst staining of untreated control cells had normal morphology with intact round nucleus which emitted by a weak blue fluorescence. It is interesting to note that both the HepG2 and PC3 cells were treated with A. marmelos AgNPs, A. paniculata AgNPs, A. scholaris AgNPs and C. asiatica AgNPs for 48 h and exposed cancer cells showed bright blue colour emission results in nuclear fragmentation with increased condensation of chromatins leading to initiation of apoptosis. Number of apoptotic cells was increased at 75.68, 27.01, 43.76, 40.32 µg ml−1 and 54.68, 32.15, 53.16, 52.99 µg ml−1 for A. marmelos AgNPs, A. paniculata AgNPs, A. scholaris AgNPs and C. asiatica AgNPs against HepG2 and PC3 cancer cell lines, respectively and the synthesized NPs could influence cell apoptosis in the HepG2 (figures 7(p)–(t)) and PC3 (figures 8(p)–(t)) cell lines. It has been reported that tamoxifen loaded chitosan nanoparticles showed antitumor activity in breast cancer cells [36].
3.7. DNA fragmentation analysis
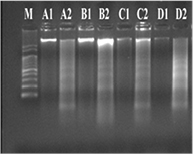
The DNA fragmentation assay was carried out to determine whether the death of both PC3 and HepG2 cells had occurred due to the cytotoxic effect of AgNPs treatment or not. The DNA fragmentation experiment was performed using DNA samples obtained from AgNPs treated cell lines for 48 h along with control. Results showed that DNA ladder formation with low molecular size was observed in the treated group, while high molecular weight intact DNA band was noticed in the untreated cancer cell lines. Hence, both the cancer cell lines were found to be sensitive to biosynthesized silver nanoparticles at the IC50 dose. Thus, the cancer cell growth inhibitory effect of AgNPs was closely associated with DNA-fragmenting mechanisms due to the occurrence of apoptosis (figure 9). However, the untreated PC3 and HepG2 cells did not show any DNA fragmentation. Similar results were also reported previously in Citrullus colocynthis mediated silver nanoparticles [33] and on Cassia auriculata leaf extracts [37]. It is reported that many chemotherapeutic drugs, including Vp16 and mitomicin C, induce cells to undergo apoptosis through damage of nuclear DNA [38]. Apoptotic cells are generally assumed that the toxicity of antitumor drugs is the consequences of their ability to cause genomic DNA damage in cancer cells [39].
Figure 9. DNA fragmentation analysis of PC3 and HepG2 cell lines: lanes: (M) 100 bp marker; (A) AsAgNPs treated PC3 (A1) and HepG2 (A2) cells, (B) ApAgNPs treated PC3 (B1) and HepG2 (B2) cells, (C) AmAgNPs treated PC3 (C1) and HepG2 (C2) cells, (D) CaAgNPs treated PC3 (D1) and HepG2 (D2) cells (1) PC3 and (2) HepG2 cells. Cell lines were treated with the AgNPs (IC50 concentration) for 48 h. Note: A. scholaris (As), A. paniculata (Ap), A. marmelos (Am) and C. asiatica (Ca).
Download figure:
Standard image High-resolution image
4. Conclusion
In conclusion, the present protocol showed that the environmentally renewable source of leaf extracts was used as an effective bioreducing and capping agent for the synthesis of silver nanoparticles. Fourier transform infra red spectroscopy confirmed the presence of triterpenoids, diterpenoids, tannins, flavonoids and phenolic compounds on the synthesized silver nanoparticles as well as in the aqueous extracts. The SEM results showed that the shape and size of the AgNPs were mostly spherical shape. The present results together suggest that A. marmelos AgNPs, A. paniculata AgNPs, A. scholaris AgNPs and C. asiatica AgNPs possess superior cytotoxic activity due to the presence of various industrially important biomolecules, whereas A. paniculata AgNPs and C. asiatica AgNPs exhibit highest anticancer activity against HepG2 and PC3 cell lines than A. marmelos AgNPs and A. scholaris AgNPs. Further, the data confirm that A. marmelos AgNPs, A. paniculata AgNPs, A. scholaris AgNPs and C. asiatica AgNPs were found to be less toxic at lower doses to normal Vero cell lines. Results further suggested that greater cytotoxic and apoptotic activity of A. paniculata AgNPs and C. asiatica AgNPs for HepG2 and PC3 cancer cells was due to the presence of diterpenoids and tannins. To the best of our knowledge, this is the first report on synthesis of highly stable metallic silver nanoparticles using aqueous leaf extracts of A. marmelos, A. scholaris, A. paniculata and C. asiatica and its potential anticancer activity against HepG2 and PC3 cell lines.
Acknowledgment
The authors wish to thank Periyar Univeristy, Salem for providing University Research Fellowship-(UGC-URF) to G. Prasannaraj.