

Abstract
Surface-enhanced Raman scattering (SERS) is a highly sensitive measurement technique that provides Raman peaks at different Raman shift for different molecule structures. The SERS sensor is potentially used to detect food contamination and monitor environmental pollutants. A self-developed SERS system for specific analysis with low development cost is a challenging issue. This study attempts to develop a simple SERS sensor system for detection of bisphenol A (BPA) molecule using SERS substrate of silver nanoplate film. A SERS sensor system was developed, consisting of a light source to excite analyte molecules, Inphotonic Raman probe, sensor chamber and spectrophotometer as an analyser system. A duplex fibre optic is used to transmit light from the source to the probe and from the probe to the spectrophotometer. For SERS measurement, BPA detection was done by comparing the Raman signal spectra of the BPA on the quartz substrate and BPA on the silver nanoplate film. This SERS sensor successfully sensed BPA with SERS enhancement factor (EF) 5.55 × 10³ and a detection limit of BPA concentration at 1 mM.
Export citation and abstract BibTeX RIS

Original content from this work may be used under the terms of the Creative Commons Attribution 3.0 licence. Any further distribution of this work must maintain attribution to the author(s) and the title of the work, journal citation and DOI.
1. Introduction
Raman spectroscopy provides vibrational information of molecular bonding and symmetry for sample identification and quantitation. The report of molecular vibrational can be translated to Raman scattering intensity versus Raman shift spectrum. This technique is commonly used in chemistry and biology analysis due to the ability to directly sense with high accuracy, facile sample preparation, low contamination and damage risks to the sample [1]. Unfortunately, Raman scattering intensity is very low compared to Rayleigh scattering. To overcome this problem, a powerful laser was used in a spectroscopy system to improve the sensitivity of spectroscopy and lower the concentration limit of molecular detection. Consequently, this system has become more complex and expensive. Interestingly, this Raman measurement technique has been expanded to facile and low cost surface-enhanced Raman scattering (SERS). The SERS phenomenon was extensively reported in toxic material detection by enhancing molecular Raman intensity using plasmonic nanometal properties [2–4].
The sensitivity of the SERS technique can be determined by calculation of the enhancement factor (EF). This analysis is able to describe how successful the enhancement of Raman intensity is after the analyte is absorbed on the nanometal surface. However, calculation and analysis of EF depends on the definition used in the SERS measurement. Because of the difficulty in assuming the number of molecules which obtained the SERS signal, a few definitions are given in order to determine the EF value. Generally, EF can be categorised into: (i) maximum SERS EF, and (ii) average SERS EF [5].
Typically, maximum SERS EF analysis can be used for a predetermined SERS area also known as the hot spot area. In this hot spot, the SERS signal was investigated from the specific molecule absorbed on a particular nanometal surface area. The maximum SERS EF obtained in this SERS measurement can reach up to 106 for a nanometal sphere. Hence, the high sensitivity of the maximum SERS EF is potentially used in detecting a single molecule. However, researchers have been inventing or controlling the SERS measurement towards the hot spots area [6, 7]. Researchers have been trying to set the analyte on the hot spots area and place the analyte on the nanometal surface that provided the highest SERS signal. Thus, the average SERS EF definition was used in order to get an accurate EF value [8]. The average SERS EF inspects the whole area that provided the SERS signal of the analyte on the nanometal surface. The enhancement Raman or SERS signal produced by the analyte molecule that randomly absorbed on the nanometal corresponds to the average SERS EF. As a result, the EF value can be as low as 100 to 103 but can reach 106 by using a certain SERS substrate.
Bisphenol A (BPA) is an organic chemical that is scientifically known as 2,2-(4,4-dihydroxydiphenyl) propane. Almost 99.9% of BPA has been used by the manufacturing plant to produce products such as dental fillings, coating protection for beverage and food containers, paint powder, lens automotive, optical lenses, thermal paper, wrapping paper and pads for electrical and electronic components [9]. However, this production process and the use of BPA in daily life can be harmful to human health and the environment. The percentage presence of BPA residue in soil has been reported at 25%, water consumption at 52% and the excretory system at 23% [10]. Meanwhile, the presence of BPA has been revealed in canned pet food, cereal, honey, milk, drinking water, fish and meat [11]. Thus, in this study we attempt to develop highly sensitive SERS sensors to detect BPA molecules using a SERS silver nanoplate substrate. The simple design of the sensor system and measurement technique has been discussed to study the developed sensor performance towards BPA detection.
2. Experimental
The SERS sensor system comprises four main parts: (i) a light source to excite the analyte sample, (ii) a sensor chamber that contains the analyte sample stage, (iii) fibre optic to drive light from the source to sensor chamber and, (iv) the analyser system. A schematic system sensor was illustrated in figure 1. This sensor was built based on existing Raman spectroscopy. However, this system was designed by combining small components to be one compact system compared to bulk Raman spectroscopy which has a more complex design.
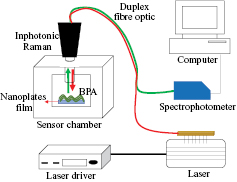
Figure 1. A schematic of the home-made SERS sensor.
Download figure:
Standard image High-resolution imageThe light source system has a butterfly laser diode, 785 nm (PD-LD Inc., New Jersey, USA) which is placed on a mount system (Arroyo Instrument, California, USA) and connected with a laser driver (Arroyo Instrument, California, USA). This mount laser was equipped with a cooling system for laser temperature safety. A sample was placed on the sample stage inside the sensor chamber where the position of the stage was fixed and the distance between the end of Raman probe and sample (working distance) is 7.5 mm. An Inphotonic Raman probe was connected to the light source and analyser system by a duplex fibre optic. The duplex fibre optic probe has two arms, namely excitation and collection arms. The excitation arm is used to emit light to the sample and the collection arm will congregate the formed scattering light by the sample. After that, the scattering light was transmitted to the analyser for interpreting the analytical result. The analyser system has a QE65000 Raman spectrophotometer (Ocean Optics, Florida, USA) and a computer. This spectrophotometer was completed with SpectraSuite software (Ocean optics, Florida, USA) to analyse Raman and SERS spectra.
This SERS sensor design was firstly calibrated by comparing a Raman spectrum of BPA that captured using this sensor and a standard Raman spectroscopy (Horiba Scientific, New Jersey, USA). After that, SERS measurement was then carried out to study the performance of the home-made SERS sensor towards the detection of BPA molecules. This experiment also observed the sensitivity of the sensor towards eight concentrations of BPA.
The SERS substrates used in this study are silver nanoplate films on a quartz surface as reported previously [12]. The silver nanoplate film was prepared using a self-assembly technique by immersing the quartz substrate into the colloidal silver nanoplates for 15 min. After that, the substrate was washed with copious amounts of deionised water and dried prior to use for the SERS measurement.
BPA was purchased from Sigma Aldrich with 99.9% of purity. The BPA solution sample was prepared by diluting BPA powder with absolute ethanol into eight concentrations namely 0.001 M, 0.005 M, 0.01 M, 0.025 M, 0.05 M, 0.1 M, 0.5 M and 1.0 M. To ensure the mixtures solutions were perfectly dissolved, the solutions were treated with ultrasonic at room temperature for 5 min.
3. Results and discussion
A SERS sensor system was successfully developed from optical components. This system consists of a light source to excite the analyte, a Raman probe, a sensor chamber and spectrophotometer as an analyser. A duplex fibre optic was used to transmit light from the source to probe and from the probe to spectrophotometer. Prior to the SERS measurement towards BPA detection, the SERS design system was calibrated by comparing the Raman spectrum of BPA that was captured using the home-made sensor and Horiba Raman spectroscopy.
In this typical calibration, the BPA sample used is in the powder phase and placed on a cleaned quartz substrate. Then, the BPA was positioned on the sample stage inside the chamber sensor to expose with laser light. An optimum working distance between the sample and Raman probe was fixed at 7.5 mm. At this distance, the probe emitted laser light to BPA through the excitation arm and then the collection arm collected a scattered light by the sample. A QE65000 spectrophotometer analysed the scattered light and translated it to the Raman spectrum. Figure 2 presents the Raman spectra of BPA molecules that were captured from two different systems.
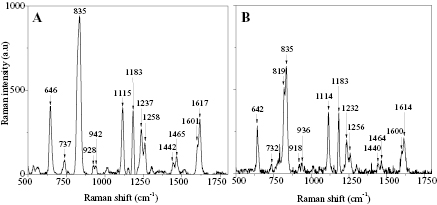
Figure 2. Raman spectrum of BPA from (A) Horiba Raman spectroscopy, and (B) home-made sensor.
Download figure:
Standard image High-resolution imageHoriba Raman spectroscopy detected 13 Raman peaks of BPA, meanwhile, the sensor detected 14 peaks. From figure 2(A), it was clearly seen that one additional peak of BPA that was sensed by this sensor is 819 cm−1. However, this peak also has been detected by another researcher [13]. The detected Raman peaks of BPA from the sensor was almost left-shifted at 0 cm−1 to 10 cm−1 (0–1%) compared to the detected peaks from the spectroscopy. Based on the comparison towards counts and positions of Raman peaks from both systems, it can be summarised that the home-made sensor design is reliable and suitable to use in the next SERS study.
Four samples were prepared to study the sensitivity of the SERS sensor towards BPA detection, namely quartz substrate, silver nanoplate film, BPA on the quartz substrate and BPA on silver nanoplate film. In this experiment, 0.5 M concentration of BPA solution was dropped and dried on quartz substrates and silver nanoplate film. Figure 3 presented the Raman spectra of the four samples that were recorded by this home-made sensor. It was vividly seen that the quartz substrate and nanoplates without BPA molecules have no Raman peak. However, the sensor exhibited 14 Raman peaks with the presence of BPA molecules on the surface (as described in the calibration study). Interestingly, the Raman intensity of BPA on the nanoplate surface was enormously enhanced after BPA absorbed on the nanoplate's film surface. This is due to the plasmonic effect of silver nanoplates which is mentioned as the SERS spectrum.

Figure 3. Raman spectra of quartz substrates and silver nanoplate film; without and with the presence of BPA molecules.
Download figure:
Standard image High-resolution imageThe sensitivity of the sensor performance can be quantitatively determined by SERS EF. In this study, we calculated EF by average SERS EF definition using following equation [14].

NRaman and NSERS are the average number of molecules in the scattering volume for the Raman and SERS measurement, respectively, and IRaman and ISERS are Raman and SERS intensity, respectively. In this experiment the BPA molecules were dropped and dried on the silver nanoplate film surface and then the formed BPA layer was assumed to be a monolayer, so equation (1) can be rewritten as

MSERS and MRaman are the number of molecules dropped on the quartz and nanoplate film surface, respectively; SSERS and SRaman are the geometry area for the BPA molecules deposition. In this study the volume of BPA solution used is 0.02 ml and the solution was dropped and dried on the substrates surface with a measurement of 1.2 × 1.2 cm2. After 2 min, the droplet was allowed to dry at room temperature and formed a circle deposition in the surface with 1.1 cm of diameter. This circle diameter for the SERS and Raman measurement is similar because the sizes of the used quartz substrate are the same. Therefore, the SSERS and SRaman value can be ignored. A is the laser spot, due to the SERS and Raman spectrum being produced at a similar excitation degree, and the same Raman probe and area laser spot, so the value can be neglected. Therefore, the last equation can be derived as

Referring to figure 3, here we discussed the EF calculation measurement for one Raman shift at 642 cm−1 using the average SERS EF definition. Only seven Raman shifts will be calculated using a similar step because another minor seven peaks did not show significant enhancement towards the SERS measurement [15]. A standard BPA Raman spectrum was firstly recorded using the home-made sensor as a reference spectrum. The reference sample was prepared by placing 0.022 mol of BPA powder on a quartz substrate. Meanwhile, the concentration of BPA used (converted in mol) in figure 3 is 2.499 × 10⁻³ mol. Using these data we have MRaman = 1.3248 × 10²², MSERS = 1.5054 × 10²¹, with IRaman = 81 and MSERS = 409, the calculation of EF according equation (3) is EF = 4.44 × 101.
Therefore, the calculated SERS EF for Raman shift at 642 cm−1 is 4.44 × 101 and another six peaks of Raman shift was given in table 1. Based on this EF analysis, the average of EF for this sensor is from 4.44 × 101 to 2.28 × 10². It can be summarised that this SERS sensor system is able to give good sensitivity for BPA molecule detection by using nanoplate film as a SERS substrate. To observe the stability of the SERS spectrum towards time, we recorded the Raman and SERS spectrum for 120 min. We found that Raman intensity of BPA on the quartz substrate and SERS intensity of BPA on the nanoplate film were stable within 90 min of the experiment.
Table 1. SERS EF for each Raman shift of BPA.
| Raman shift (cm−1) | SERS EF |
|---|---|
| 819 | 4.53 × 101 |
| 835 | 5.32 × 101 |
| 1114 | 6.38 × 101 |
| 1183 | 7.19 × 101 |
| 1600 | 2.28 × 10² |
| 1614 | 6.97 × 101 |
The sensitivity sensor towards the variation of BPA concentrations was studied to observe the limit of detection for this sensor. Eight concentrations of BPA are used namely 0.001 M, 0.005 M, 0.01 M, 0.025 M, 0.05 M, 0.1 M, 0.5 M and 1.0 M. The captured SERS spectra of these concentrations were analysed and the linearity relationship graph between SERS intensity and BPA concentrations was then plotted as shown in figure 4. Based on the linearity analysis, the position of the SERS peaks was not changed but the SERS intensity was increasing towards the increasing of BPA concentrations, except for 1.0 M. The interaction of the incident photon with the area surface of BPA and the nanoplate particle not being effective yet might be the reason for the decreasing of SERS intensity. High concentration of BPA also potentially formed a high percentage of bigger sizes of BPA on the surface. However, the correlation coefficients (r) of this linearity relationship are good between 0.952 to 0.988.
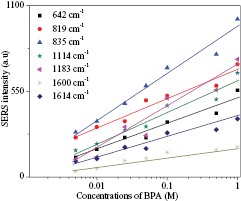
Figure 4. Linearity relationship between SERS intensity and BPA concentrations.
Download figure:
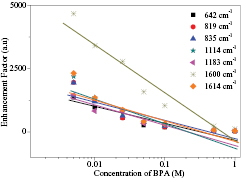
Standard image High-resolution imageBy using the result of SERS intensity towards the eight concentrations of BPA, we studied the linearity relationship between SERS EF with the variation of BPA concentrations. The linearity relationship graph is shown in figure 5. It was generally found that EF was increased with decreasing BPA concentrations where the SERS EF range from 2.80 × 101 to 5.55 × 10³. Meanwhile, the correlation coefficients (r) of this linearity relationship are good between 0.849‒0.958. The low detection of this home-made sensor is 0.001 M using silver nanoplate substrates.
Figure 5. Linearity relationship between SERS EF and BPA concentrations.
Download figure:
Standard image High-resolution image
4. Conclusion
A SERS sensor system consisting of a light source, Raman probe, fibre optic, sensor chamber and spectrophotometer was successfully designed and provided Raman spectrum of BPA as presented from standard Raman spectroscopy. In additional, this built system is more compact and cheap than standard Raman spectroscopy. The SERS sensor also showed a high sensitivity towards BPA detection with an average SERS EF 5.55 × 10³ and a limit of detection at 1 mM.
Acknowledgments
We thank the Malaysian Ministry of Higher Education, University Kebangsaan Malaysia and Flinders University of South Australia for financial grant of MRUN-2015-002.