


Abstract
Biodistribution studies provide basic information to design and perform various applications of superparamagnetic iron oxide magnetic nanoparticles (SPIOs) in biomedicine such as drug delivery, MRI as well as hyperthermia. Recently, several quantitative measurements as well as new imaging methods have been used to characterize the SPIOs distribution in organs and in tissues of animal model. In this report we used the fabricated iron oxide nanoparticles coated with two block copolymers of polystyrene-co-polyacrylic acid (St-co-PAA) and polylactic acid-co-polyethylene glycol (PLA-PEG). The biodistributions were investigated ex-vivo for several organs of both healthy and Sarcoma transplanted Swiss mice. The SPIOs concentrations were verified mainly by magnetic inductive heating (MIH) measurement with a combination with atomic absorption spectroscopy (AAS). The results indicated the density detected highest in liver and lowest in kidney. The SPIOs concentration increased significantly up to 24 h after the injection. The observations by our two methods not only are in agreement with each other but also consistent with the tendency reported by other techniques. Discussion will also concern injection strategy for various aspects of hyperthermia applications.
Export citation and abstract BibTeX RIS

Original content from this work may be used under the terms of the Creative Commons Attribution 3.0 licence. Any further distribution of this work must maintain attribution to the author(s) and the title of the work, journal citation and DOI.
1. Introduction
Magnetic nanoparticles (MNPs) have gained increasing research interest because of their potential applications in various domains including electronics, industry and biomedicine. For the latter, MNPs have shown useful in several application fields such as magnetic resonance imaging (MRI) contrast agent, cancer hyperthermia, drug delivery [1–3] as well as devitrification agent for thawing cryopreserved biomaterials [4, 5]. A key property of MNPs that create the base for their three latter applications is that MNPs can locally generate heat when being applied in a RF magnetic alternative field [5–14]. Cancer hyperthermia bases on the killing of cancer cells with temperature in the range of 42–49 °C while healthy cells can still survive in such a heating. This potential has attracted researches by several groups for both fabrication of high performance heating particle systems as well as development of irradiating machine (see e.g. [14, 15]). While it is well known that MNP-linked/loaded with a drug can be delivered by driving using a magnetic field, several reports have indicated that the drug in such system can additionally be released remotely by a control applying of alternative field [9–13]. Various systems with Fe3O4 particles in the core capped by thermosensitive polymer [9–12] as well as by other organic materials [13] have been developed to show potential for the control release. Finally, a few recent reports [5, 6] have demonstrated a newly emerging application of MNPs in thawing of bulk cryopreserved biomaterials, taking into account the advantages in homogeneity and size independence for the rewarming matter.
Magnetic inductive heating (MIH) performance of a ferrofluid is described by a quantity called specific absorption rate (SAR) or specific loss power (SLP), which is defined as:
where Ch is the liquid heat capacity, ms is MNP mass, mi is the solute mass, dT/dt is the initial rate of temperature increase. The loss power is tightly related with the dissipation loss paid by the Neel and Brown relaxation of the MNPs in the alternative field. In order to eliminate the extrinsic influence of the irradiation field, so called intrinsic loss power (ILP) defined as (2) has been introduced:
where H0 and f are, correspondingly, the field amplitude and frequency.
For noninteracting nanoparticles, the ILP is proportional to the saturated particles magnetization, whereas the relationship is not clear in the case of agglomerated and/or interacting nanoparticle system [16].
Experimentally, SLP can be determined from the measured temperature evolution curves, whose two characteristic parameters are the initial slope dT/dt and the 'saturation' temperature Ts, gained at a given irradiation time ts. In our experiments Ts, and corresponding temperature increase ΔT were taken at ts = 1200 s for all the heating samples. Both these characteristic parameters increase with increasing the MNPs concentration, c. The main aim of the present paper is the benefit of linear dependence of dT/dt and Ts on c to determine biodistribution of MNPs in animal organs.
In fact, the issue of biodistribution of MNPs in various animal organs has been concerned intensively for the past decade, using different methods including imaging techniques [17–19] as well as magnetic measurements [19–24]. The Spanish group by Lazaro and Gutierrez [20–24] has successfully applied temperature dependence of AC susceptibility to elucidate that MNPs most accumulate in liver and somehow less in spleen but not significantly in other organs.
Similar information was confirmed by Mejfas et al [19] via TEM image analysis and low temperature magnetization measurement. Recently, Zhuang et al [18] have reported an ex vivo study of MNP distributions in liver, spleen and lung of mouse models at three times of 0.25, 5 and 72 h after the injection. To our knowledge, no report has been found in literature regarding the MNP biodistribution by MIH effect. Our study can address also the dose and administration route dependence of the effect. We used both healthy and Sarcoma cancer transplanted mice treated by two systems of Fe3O4 NPs coated by two different copolymers. For a few mouse models we performed additionally the Fe concentration analysis by using atomic adsorption spectroscopy (AAS), the method that has used earlier for experiment without MNPs [25–27].
2. Experimental
2.1. MNPs conjugates
The Fe3O4 nanoparticles were prepared by co-precipitation method, which exhibited diameter of around 15 nm and saturation magnetization of about 65 emu g−1. The particles were used as cores to be coated by two types of copolymers, namely: poly(styrene-co-acrylic acid) and polylactide acid—polyethylene glycol, correspondingly in [28, 30] denoted as Fe3O4@St-co-PAA and Fe3O4@PLA-PEG; and in this paper will be referred to as Cop1 and Cop2. Details of fabrication and characterization of the two systems are described in [28–30], respectively. For administration to mice, the coated NPs were diluted in distilled water with concentrations of 10 mg ml−1 and 9 mg ml−1 for Cop1 and Cop2, respectively. The DLS measurements showed the hydrodynamic diameter of the two ferrofluids differs from each other of about ten times, namely Dh(Cop1) = 450 nm whereas Dh(Cop2) = 45 nm.
2.2. Mouse models
8 week-old Swiss mice of average weight of 20 g were obtained from the National Institute of Hygiene and Epidemiology (Vietnam). The mice were then cultured in special room of temperature about 25 °C providing regularly with food and water. Sarcoma cancer was transplanted subcutaneously, and the tumor development was monitored for about 3–4 weeks so that tumor size reached about 6 × 6 × 6 mm3 when starting the ex vivo experiment. The average weight of the mice was then of about 40 g. Organs including liver, lung, spleen, blood, kidney and tumor samples were taken for investigation (figure 1).

Figure 1. Images of a healthy (a) and Sarcoma cancer (b) mouse, and location of studied organs (c).
Download figure:
Standard image High-resolution imageThe ferrofluids were administrated to the mice mainly via intravenously injecting at tail, except for one model series where the subcutaneous injection was used directly into the tumor site. The mice models were sacrificed at various times after the injection, i.e. 0.25, 1, 3, 24 and 48 h. The masses of the organ samples for MIH measurements were chosen to be of around 0.2 g each.
The dose of injected ferrofluid varied in the range from 1–3 mg/mouse and 0.2–0.4 mg/mouse correspondingly for the intravenous and subcutaneous/direct injection. All the mice models are gathered in table 1. H and C letters in the mouse names mark correspondingly the healthy and cancer mouse, while other letters/numbers refer to injection substance (column 3), injection route and amount (column 4), and the waiting time (column 5) after the injection.
Table 1. Summary of experimental mouse models.
| Serie | Mouse name | Magnetic fluid used | Injection way, mount (mg) | Wait time | Measurement used |
|---|---|---|---|---|---|
| 1 | C-0Cop2 | — | No injection | — | MIH, AAS |
| C-v1Cop2-1 | PLA-PEG | Vein tail, 1 mg | 1 h | MIH, AAS | |
| C-v1Cop2-24 | PLA-PEG | Vein tail, 1 mg | 24 h | MIH, AAS | |
| C-v1Cop2-48 | PLA-PEG | Vein tail, 1 mg | 48 h | MIH | |
| 2 | H-v2Cop2-1 | PLA-PEG | Vein tail, 2 mg | 1 h | MIH |
| H-v2Cop2-24 | PLA-PEG | Vein tail, 2 mg | 24 h | MIH | |
| H-v3Cop2-1 | PLA-PEG | Vein tail, 3 mg | 1 h | MIH | |
| H-v3Cop2-24 | PLA-PEG | Vein tail, 3 mg | 24 h | MIH | |
| 3 | C-0Cop1 | — | No injection | — | MIH, AAS |
| C-v2Cop1-1 | St-co-PAA | Vein tail, 2 mg | 1 h | MIH, AAS | |
| C-v2Cop1-3 | St-co-PAA | Vein tail, 2 mg | 3 h | MIH | |
| 4 | C- 0Cop1 | — | No injection | — | MIH |
| C-d.3Cop1-.15 | St-co-PAA | Direct tumor 0.3 mg | 10 min | MIH | |
| C-d.4Cop1-.15 | St-co-PAA | Direct tumor 0.4 mg | 10 min | MIH | |
| C-d.2Cop1-.25 | St-co-PAA | Direct tumor 0.2 mg | 15 min | MIH | |
| C-v1.5Cop1-.5 | St-co-PAA | Vein tail, 1.5 mg | 30 min | MIH | |
2.3. MIH measurement
In the present experiment a generator (RDO HFI 5 kW) was used to create an alternating magnetic field of amplitude from 40 to 100 Oe at frequency from 170–240 kHz. The field amplitude and frequency used in the MIH measurements for Cop1 and Cop2 samples are correspondingly (60 Oe, 236 kHz) and (80 Oe, 176 kHz).
The temperature was measured using a commercial GaAs-sensor (Opsens). The sensor tip was embedded for 2 mm below the sample surface to ensure a good thermal contact. The absolute error of temperature measurement was not larger than 0.5°, whereas the influence of specimen size on the elevation temperature was supposed to be not larger than 1° for the samples of 5–10 mm diameter.
The fluid samples for standardization measurement were simply obtained by dilution of the starting ferrofluids in distilled water. MNPs in agar samples were prepared by mixing proper amounts of agar powder in 80 °C water, dropping the necessary amount of ferrofluid into agar solution, followed by a slow cooling down to room temperature during 7 h to get gel form of the product.
In order to search for any heating contribution coming from animal blood, the organ samples of the mice treated by Cop1 were perfused after separation, whereas those of the mice treated by Cop2 were freeze-dried without perfusion and preserved at low temperature.
2.4. AAS method
In our experiment we used a Shimadzu spectrometer for the analysis. For the mice model series treated by the MNP materials only organs harvested at 1 h were analyzed by AAS. The sample preparations for the AAS measurements were conducted according to the following protocol. Organ sample (each of 1 g) was put into a Kjedahl bottle, an amount of 10 ml H2SO4 acid was added, and the whole was well shaken. Heat the bottle to 450 °C for 15 min, then add a few drops of 70–72% perchloric acid in continuing the heating. When the solution became transparent bright, the sample was successfully prepared. Adjust the solution volume with an amount of distilled water to get specimens ready for AAS analysis. The iron content in the sample can be calculated as:
3. Results and discussion
3.1. Heating standardization
The relationship between heating curves and the MNPs concentrations were characterized for both the Cop1 and Cop2 materials.
Heating curves are presented in figure 2 and the characteristic parameters are gathered in table 2. As can be noted, in all the three material sample series the dependence of initial temperature increase on the MNPs concentration can be fited well by linear relationship. The obtained slope for Cop2 material is about 0.054 and that for Cop1 is 0.124. The reduced heating performance for the agar samples is explained mainly by elimination of the Brown dissipation contribution in the gel medium [7], whereas small heating power observed for 1–5 mg ml−1 Cop2-fluid samples is assumed to be originating from existence of particle agglomeration and or interparticle interaction in such dense ferrofluid [16]. For the analysis purpose of current work it is satisfied to apply the linear increase of heating powers versus concentration observed in both liquid and gel forms of the two MNPs materials. The linear dependence of the temperature elevation degree, ΔT, elucidated in figure 2(b), suggests a possibility to use this quantity instead of dT/dt for MNP content discussion.

Figure 2. Concentration dependence of initial heating rate of Cop1-fluid (a), Cop2-fluid (c) and Cop2-agar (d) samples; plot (b) is that of temperature elevation degree ΔT for Cop1.
Download figure:
Standard image High-resolution imageTable 2. Heating performance as dependent on concentration of Cop1 and Cop2 MNPs.
| Cop1-fluid | Cop2-fluid | ||||
|---|---|---|---|---|---|
| c (mg ml−1) | ΔT (°C) | dT/dt (°C s−1) | c (mg ml−1) | ΔT (°C) | dT/dt (°C s−1) |
| 1.0 | 47.7 | 0.12 | 5.0 | >64.3 | 0.271 |
| 0.7 | 35.8 | 0.073 | 4.0 | 63.3 | 0.192 |
| 0.5 | 25.9 | 0.046 | 3.0 | 59.5 | 0.161 |
| 0.3 | 17.8 | 0.042 | 2.0 | 47.8 | 0.116 |
| 0.1 | 13.1 | 0.02 | 1.0 | 28.0 | 0.042 |
| Cop2-agar (c in mg cm−3) | |||||
| 0.1 | 6.9 | 0.011 | |||
| 0.05 | 6.4 | 0.0084 | |||
| 0.025 | 4.8 | 0.0069 | |||
| 0.00125 | 3.2 | 0.0053 | |||
3.2. Nontreated C-0Cop1 and C-0Cop2 mice
Heating curves measured for the organs samples, prepared by the freeze-dried way, of the nontreated mouse C-0Cop2, are presented in figure 3(a). Figure 3(b) depicts the behavior of tumor samples harvested via the freeze-drying (C-0Cop2) versus the perfusion (C-0Cop1) way. The heating parameters are gathered in table 3. It is interesting to note that the temperature elevation degree for the freeze-dried organs, in the range from 3.1 to 4 oC, are rather significant, whereas a measurement for the tumor sample prepared with the perfusion showed almost no heating performance at all. The data of Fe contents obtained by atomic absorption spectroscopy (table 3) also showed much smaller values received for the organs harvested with perfusion as compared correspondingly to the freeze-dried samples. This difference in iron concentration related with different way of organ sample preparation is also confirmed by an additional MIH experiment for organs of a healthy mouse.
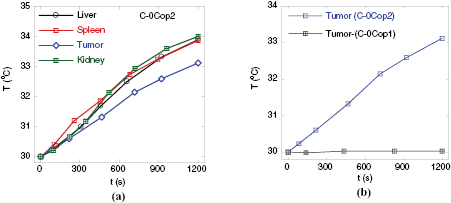
Figure 3. Temperature evolution in: various organs of nontreated mouse C-0Cop2 (a), and tumor samples prepared by perfusion versus freeze-drying way (b).
Download figure:
Standard image High-resolution imageTable 3. Iron content in organs of nontreated mice informed by AAS (c) and MIH (ΔT0, dT/dt) methods.
| Mouse Organ | C-0Cop2 | C-0Cop1 | ||||
|---|---|---|---|---|---|---|
| c (mg kg−1-Fe/organ) | ΔT0 (°C) | dT/dt (°C s−1) | c (mg kg−1-Fe/organ) | ΔT0 (°C) | dT/dt (°C s−1) | |
| Liver | 58 ± 4.5 | 3.9 | 0.0039 | 50 ± 2.5 | — | — |
| Lung | — | — | — | 54 ± 2.7 | — | — |
| Spleen | 124 ± 3.6 | 3.9 | 0.0040 | 27 ± 1.8 | — | — |
| Tumor | 66.5 ± 4.2 | 3.1 | 0.0028 | 10 ± 0.5 | 0.3 | 0.0001 |
| Kidney | 84.9 ± 3.9 | 4.0 | 0.0041 | 12 ± 0.6 | — | — |
As indicated in literature [21, 24], iron in living biomatter exists in metalorganic compound (hemoproteins) or in iron oxyhydroxide nanoparticles surrounded by proteins (ferritins). The difference in the iron contents for the samples prepared with and without perfusion originates from the amounts of hemoproteins and ferritins remained in the products which are in the range of 10–120 mg Fe kg−1 organ. As indicated by the standardization in figure 2(d), the average value of temperature increase of 3.5 °C corresponds to a Fe3O4 content of about 20 mg dm−3, which is in quite agreement with the obtained AAS data. Although this hemoprotein/ferritin-related heating alone is not sufficient for ensuring of MIH cancer hyperthermia, our observation could provide important notice to accurately design an agent dose for the magnetic hyperthermia.
3.3. Heating results for intravenously injected mice with low dose: C-v1Cop2-t
Heating curves of liver, spleen, kidney and tumor of mice intravenously injected with 1 mg Cop2 material, harvested at 1, 24 and 48 h are presented in figures 4(a)–(c), respectively, and the analyzed heating parameters are given in table 4. The subtraction of ΔT in table 4 by the corresponding ΔT0 from table 3 shows that a clear increase in heating performance was observed for the case of liver samples harvested at 1 and 24 h after the injection, while the changes for other organs are not significant. As the additional increase of about 2 °C for the case of liver is believed to originate from the heating effect contributed by the injected MNP, the injection by dose of 1 mg 40 g−1 of mouse weight caused an accumulation most in liver. This observation is in agreement with other earlier reports of AC susceptibility by Mejfas et al [19] and Lazaro et al [23] group, using the MRI dose (15 µmol Fe kg−1, 85 µmol Fe kg−1).
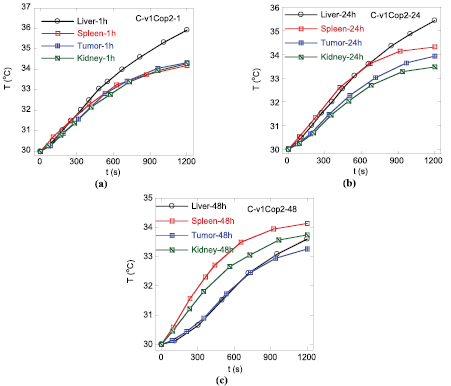
Figure 4. Temperature evolution in organs of mice intravenously injected with 1 mg Cop2, at waiting times of 1 h (a), 24 h (b) and 48 h (c).
Download figure:
Standard image High-resolution imageTable 4. Heating parameters of organs of C-v1Cop2 mice harvested at various times.
| Mouse organ | C-v1Cop2-1 | C-v1Cop2-24 | C-v1Cop2-48 | |||
|---|---|---|---|---|---|---|
| ΔT (°C) | dT/dt (°C s−1) | ΔT (°C) | dT/dt (°C s−1) | ΔT (°C) | dT/dt (°C s−1) | |
| Liver | 5.9 | 7.9 × 10⁻³ | 5.4 | 7.6 × 10⁻³ | 3.8 | 6.3 × 10⁻³ |
| Spleen | 4.2 | 7.7 × 10⁻³ | 4.3 | 7.1 × 10⁻³ | 4.1 | 7.1 × 10⁻³ |
| Tumor | 4.3 | 7.3 × 10⁻³ | 3.9 | 5.9 × 10⁻³ | 3.3 | 3.9 × 10⁻³ |
| Kidney | 4.3 | 6.7 × 10⁻³ | 3.5 | 5.7 × 10⁻³ | 3.8 | 6.5 × 10⁻³ |
Similar organ samples of C-v2Cop1-1 mouse were also analyzed using the AAS method, and the obtained results are given in table 5. As seen, the change in Fe content (Δc) is very strong for the liver sample, and rather small in other organs. The biodistribution of MNPs provided by AAS analysis again are consistent with those obtained by the MIH measurement in the case of mice injected with 1 mg of MNP. One could note from table 5 the fact that the MNPs tend to accumulate strongly in liver and weakly in lung, spleen and tumor was confirmed by AAS also for the case of intravenously injecting with 2 mg of Cop1 material. The MIH results will be discussed below.
Table 5. Iron concentration, c, of organs (in mg Fe/1 kg) taken from C-v1Cop2-1 and C-v2Cop1-1 mice. Δc211 = c(C-v2Cop1-1)- c(C-0Cop1), Δc121 = c(C-v1Cop2-1)- c(C-0Cop2).
| Mouse organ | C-0Cop1 | C-v2Cop1-1 | Δc211 | C-0Cop2 | C-v1Cop2-1 | Δc121 |
|---|---|---|---|---|---|---|
| Liver | 50 ± 2.5 | 150 ± 7.5 | 100 | 58 ± 4.5 | 162.5 ± 4.5 | 104.5 |
| Lung | 54 ± 2.7 | 60 ± 3.0 | 6 | — | — | — |
| Spleen | 27 ± 1.8 | 30 ± 2.0 | 3 | 124 ± 3.6 | 135.9 ± 7.9 | 11.9 |
| Tumor | 10 ± 0.5 | 15 ± 0.8 | 5 | 66.5 ± 4.2 | 96.7 ± 4.7 | 30.2 |
| Kidney | 12 ± 0.6 | 12 ± 0.6 | 0 | 84.9 ± 3.9 | 75.1 ± 3.5 | −9.8 |
3.4. Temperature evolution for the mice intraveinously injected with modulate and high dose
Temperature evolution curves of organs for mice intravenously injected by 2 mg of Cop1 material, harvested at 1 and 3 h are shown in figure 5. The analyzed heating parameters are given in table 6. The temperature elevations gained at irradiation time of 20 min are in the range from 7–20 °C with the accumulation density sequence of liver > lung > spleen > tumor/kidney.
Table 6. Heating parameters obtained for various organs of mice injected by Cop1 at 1 and 3 h.
| Organ | C-v2Cop1-1 | C-v2Cop1-3 | ||
|---|---|---|---|---|
| ΔT (°C) | dT/dt (°C s−1) | ΔT (°C) | dT/dt (°C s−1) | |
| Liver | 19 | 0.044 | 20.3 | 0.045 |
| Lung | 16 | 0.027 | 13.9 | 0.023 |
| Spleen | 8.7 | 0.014 | 11.2 | 0.016 |
| Tumor | 7.3 | 0.011 | 9.2 | 0.013 |
| Kidney | 7.2 | 0.009 | 6.8 | 0.007 |
In order to search for the maxima limit dose allowable for intravenous injection, four healthy mice of different weights were treated with 2 and 3 mg Cop2 ferrofluid (table 7). The heating curves obtained for organs samples including lung and blood are presented in figure 6, and the heating parameters are given in table 8. It is worth to notice that the dose of 3 mg of Cop2, equivalent to 330 µl, can be estimated as close to the high limit injection dose; as generally accepted as 10 volume percent of its total blood.
Table 7. Healthy mice treated by 2 and 3 mg of Cop2 material.
| Mouse model | Mouse weight (g) | Injected volume (µl) | Post injection appearance |
|---|---|---|---|
| H-v2Cop2-1 | 32 | 220 (1.98 mg) | Normally |
| H-v3Cop2-1 | 32 | 330 (2.97 mg) | Lightly shocked, awaked after 30' |
| H-v2Cop2-24 | 42 | 220 (1.98 mg) | Normally |
| H-v3Cop2-24 | 42 | 330 (2.97 mg) | Normally |
Table 8. Heating parameters obtained for various organs of healthy mice intravenously injected by 2 and 3 mg Cop2 at 1 and 4.
| Mouse organ | H-v2Cop2-1 | H-v3Cop2-1 | H-v2Cop2-24 | H-v3Cop2-24 | ||||
|---|---|---|---|---|---|---|---|---|
| ΔT (°C) | dT/dt (°C s−1) | ΔT (°C) | dT/dt (°C s−1) | ΔT (°C) | dT/dt (°C s−1) | ΔT (°C) | dT/dt (°C s−1) | |
| Liver | 20.1 | 0.038 | 22.8 | 0.043 | 13.3 | 0.024 | 17.5 | 0.034 |
| Lung | 14.8 | 0.031 | 38.2 | 0.103 | 14.2 | 0.029 | 14.5 | 0.027 |
| Spleen | 12.7 | 0.022 | 14.7 | 0.035 | 14.5 | 0.030 | 15.9 | 0.034 |
| Blood | 11.5 | 0.017 | 12.2 | 0.021 | 12.2 | 0.019 | 12.4 | 0.020 |
| Kidney | 13.4 | 0.026 | 9.9 | 0.014 | 12.4 | 0.022 | 12.2 | 0.021 |
It is easy to note an anomaly heating behavior of the lung sample of H-v3Cop2-1 mouse, where the temperature elevation ΔT reaches extremely high value of 38.2 °C, which is exceptionally higher than the case of liver specimen. We assume this exceptional biodispersion of MNPs is related with the too high dose used for the experimental mouse, namely the dose equal to 3 mg 32 g−1 weight, which made the mouse shocked for some period (see table 7).
Let us now make a comparison of H-v2Cop2-1 and C-v2Cop1-1 (tables 6 and 7). While the two mice exhibit similar heating performance of liver, the heating parameters in other organs are much higher for the case of Cop2 material than those for Cop1. We suggest such improved accumulation of Cop2 MNPs in organs other than liver might be due to rather small hydrodynamic diameter (i.e. 45 nm) of this Fe3O4@PLA-PEG particles [31].
Considering the heating parameters gained for the used doses of 3 mg and 2 mg and those obtained for the mice treated with 1 mg dose, described in paragraph 3.3, it is easy to observe a monotonous increase of heating performance with the increasing of injected amount of MNPs, depicted for the case of liver in figure 7.
3.5. Evolution of biodistributsion with waiting times
Studies of time evolution of biodistribusion of MNPs in organs after administration can provide information about the suitable time to conduct a diagnostic and/or treatment in magnetic nanomedicine. Mejfas et al [19] used low temperature magnetic measurement to carry out the biodistribution of MNPs over several time periods up to 1 month and stated that the injected MNPs can stay unaltered in vivo until one week. Recently, Zhuang et al [18] used a developed imaging method to analyze accumulation in three organs harvested at 0.25, 5 and 72 h, an increase of MNP concentration at 5 h but a strong decrease in those organs at 72 h.
In our current study we followed the accumulations of Cop1 nanoparticles in organs of cancer mice at two times of 1 and 3 (table 6, figure 5) and those of Cop2 nanoparticles of healthy mice at 1 and 24 h (table 8, figure 6) and of cancer mice at 1, 24 and 48 h (table 4, figure 4).

Figure 5. Temperature evolution in various organs of C-v2Cop1-1 (a) and C-v2Cop1-3 (b) mice.
Download figure:
Standard image High-resolution image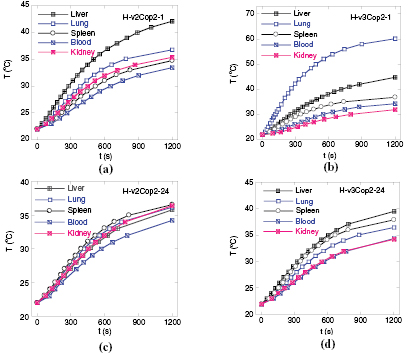
Figure 6. Temperature evolution in various organs of (a) H-v2Cop2-1, (b) H-v3Cop2-1, (c) H-v2Cop2-24 (c) and (d) H-v3Cop2-24 mice.
Download figure:
Standard image High-resolution imageTotal scenario of MNP concentration change with time is schematically represented in figure 8. The observed behavior for the two MNP materials suggested a following tendency to change MNP accumulation: from 1 h to 24 h significant amounts of MNP in organs increase, and then they start to decrease so that the values monitored at 48 h are significantly reduced.

Figure 7. Temperature increase of liver samples harvested at 1 h for mice treated by various MNP doses.
Download figure:
Standard image High-resolution image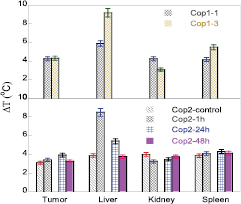
Figure 8. Scheme of time evolution of MNP accumulation in organs.
Download figure:
Standard image High-resolution image3.6. Heating results for directly injected mice
From all the above investigations, the relative accumulation of MNP in tumor versus in liver, a(tumor)/a(liver) is about 1/3 and 2/3 for intravenous administration of Cop2 and Cop1 material, respectively, so that a minimum dose to get temperature elevation sufficient for hyperthermia of liver (6 °C) would give a temperature increase in tumor not larger than 4 °C, vice verse, a dose sufficient for the latter would overheat liver. We, therefore, finally, performed investigation of MIH of tumor samples treated by direct (subcutaneous) injection into the Sarcoma tumors. Mice models and heating parameters analyzed from the curves shown in figure 9 are gathered in table 9. The results suggested that an amount of 0.2–0.4 mg of Cop1 material directly injected into the tumor, and irradiation starting at 10 min after the injection would provide the best protocol for the cancer treatment by MIH.

Figure 9. Temperature evolution in tumor of cancer mice with different injection ways (C-v1.5Cop1-.5, C-d.2Cop1-.25, C-d.3Cop1-.15, C-d.4Cop1-.15) and control mouse C-0Cop1.
Download figure:
Standard image High-resolution image
Table 9. Various time/dose combination of direct injection, DC- control mouse.
| Various mouse models | ΔT (°C) | dT/dt (°C s−1) | Saturated temperature (°C) | |
|---|---|---|---|---|
| C-d.xCop1- various t | C-v-Cop1 | |||
| C- 0Cop1 | — | 0.3 | 0.0001 | 31.8 |
| C-d.2Cop1-.25 | — | 15.7 | 0.022 | 46.4 |
| C-d.3Cop1-.15 | — | 9.2 | 0.013 | 40.7 |
| C-d.4Cop1-.15 | — | 9.5 | 0.015 | 41.0 |
| C-v1.5Cop1-.5 | 2.8 | 0.005 | 34.3 | |
4. Conclusion
It was shown that via intravenous injection the MNPs can be accumulated in organs with the contents in sequence as: liver > lung > spleen > tumor > kidney. The sequence seems to be the same for both healthy and cancer mice. The time of maximal accumulation of MNPs in organs is at 20–24 h after the injection, so that at 48 h they decrease to almost the ones before injection status. For the two MNPs ferrofluids, minimum dose allowable for hyperthermia is about 25 ppm (1 mg Fe3O4)/40 g mouse). Maximal dose was estimated to be of 75–90 ppm (<3 mg Fe3O4)/32 g mouse). Accumulations in kidney or tumor when being intravenously injected by modulate dose (2 mg = 50 ppm) is not higher than about 1/3 and 2/3 compared to those in liver, correspondingly for the Cop1 and Cop2. The fact that the latter ferrofluid exhibits higher accumulation in organs other than liver is assumed to be originating from the much smaller hydrodynamic diameter of this Cop2, i.e. 50 nm.
Unlikely to the behavior of organ accumulation of MNPs injected by vein, the accumulation of MNPs in tumor via direct administration is not monotonically increased with increasing injection dose. The research by direct injection suggest a necessary protocol for cancer hyperthermia with using an injection dose of 0.2–0.4 mg Fe3O4/0.2 g tumor, and waiting time necessary to start irradiating magnetic field of about 10–15 min.
The research in the paper clearly demonstrates that, ex-vivo MIH measurements of animal organs can be a useful and necessary method for studying applications of MNPs in biomedicine.
Acknowledgments
This work was financially supported by National Foundation of Science and Technology Development (NAFOSTED) under grant No. NCCB-DHUD.2012-G/08. Dr Luong Thien Tai and PhD student Mai Thi Thu Trang are grateful for the assistance in Cop1 fabrication.
Footnotes
- *
Invited talk at 8th Int. Workshop on Advanced Materials Science and Nanotechnology (Ha Long City, Vietnam, 8–12 November 2016).