

Abstract
By using KOH as the chemical activating agent in the synthesis, the activated carbon derived from pineapple leaf fiber (PALF) was prepared. The structure, morphology, and the surface functional groups of the as-prepared activated carbon were investigated using x-ray diffraction, field emission scanning electron microscope equipped with energy dispersive x-ray spectroscopy, and x-ray photoelectron spectroscopy. The electrochemical behavior and performance of the as-synthesized activated carbon electrode were measured using the cyclic voltammetry and the electrochemical impedance spectroscopy in 1 M Na2SO4 electrolyte solution in three-electrode setup. The activated carbon electrode exhibited the specific capacitance of 131.3 F g−1 at a scan rate of 5 mV s−1 with excellent cycling stability. The capacitance retention after 1000 cycles was about 97% of the initial capacitance at a scan rate of 30 mV s−1. Given these good electrochemical properties along with the high abundance of PALF, this activated carbon electrode has the potential to be one of the materials for future large-scale production of the electrochemical capacitors.
Export citation and abstract BibTeX RIS

Original content from this work may be used under the terms of the Creative Commons Attribution 3.0 licence. Any further distribution of this work must maintain attribution to the author(s) and the title of the work, journal citation and DOI.
1. Introduction
In order to sustainably develop renewable energy resources such as solar and wind into full use, the intermittent nature of the energy production from these resources need to be addressed. Electrochemical capacitors (ECs) or supercapacitors (SCs) are energy storage devices that can potentially be used in conjunction with the renewable energy technologies. SCs can store energy with higher power density (fast charge–discharge rate) and longer cycle life but at lower energy density when compared to batteries [1]. They can also be used together with Li-ion battery as a hybrid system to achieve high energy and high power delivery [2]. The electrode materials for SCs in the case of electrochemical double layer capacitors (EDLCs) are mostly fabricated by using the porous carbon materials that store energy at the electrode–electrolyte interface via reversible ion adsorption process [2]. In addition, the porous carbon with various microstructures, such as graphene, carbon nanotubes (CNTs), carbon aerogel, and activated carbons (ACs), have been explored for a wide range of applications, particularly as energy storage parts in portable electronic devices [3], electric and hybrid vehicles [4], water filtration [5], electrochemical sensing [6], biosensing [7], and gas sensing [8]. However, porous carbon derived from renewable biomass waste receives ever increasing attention as a potential active material for sustainable, high-performance SC electrodes due to its natural abundance, environmental friendliness, low cost, and high electrical conductivity [9–11].
Many carbon materials for SCs derived from different sources of agro-waste have been reported: for example, banana fiber [12], coniferous pine [13], cotton pulp [14], durian shell [15], rice husk [16], and yellow pine [17], all of which exhibited specific capacitances ranging from 74 F g−1 to 171 F g−1 (see table 1). Adding to this list of natural precursors is pineapple leaf fiber (PALF), which is produced as waste in large amount in Thailand, one of the main pineapple producers in the world. PALF can be obtained from pineapple leaves which remain about 40–50 leaves per shoot or 2.73 kg per shoot [18]. The pineapple leaves produced from regular harvesting typically go unused. Burning off the leaves as a way to get rid them before new cultivation begins undoubtedly causes air pollution. Therefore, if this agro-waste can be converted into high value-added product, such as the porous carbon material for SCs, the gains entail would cover not only energy sector, but also health and economic spectrum.
Table 1. Summary of the supercapacitive performances for PALF biochar-derived porous carbon in this work and other biomass-derived porous carbon in the literature.
| Carbon source | Synthesis method/activating agent | Current collector | Composition of electrode |
Electrolyte solution | Electrochemical test | Potential window (V) | Specific capacitance | Capa-citance retention | Reference |
|---|---|---|---|---|---|---|---|---|---|
| Banana fibers | Pyrolysis/10% ZnCl2 solution | Ni mesh | 75:20:5; | 1 M Na2SO4 | Cyclic voltammetry | −0.2–0.8 | 74 F g−1 at 5 mV s−1 | — | [12] |
| — | |||||||||
| Coni-ferous pine biomass | Hydrothermal and heat treatment/KOH | Ni-foam | 80:10:10; | 1 M Na2SO4 | Galvanostatic charge/Discharge | 0.0–1.0 | 90 F g−1 at 0.1 A g−1 | 86% | [13] |
| 4 mg cm−2 | |||||||||
| Cotton pulp sheet | Carbonization/— | — | 100:0:0; | 5 M KCl | Cyclic voltammetry and galvanostatic charge/Discharge | −0.8–0.0 | 90 F g−1 at 5 mV s−1 and 107 F g−1 at 1 A g−1 | 90% | [14] |
| — | |||||||||
| Durian shell | Carbonization, ultrasonic-cation and microwave method | Ni-foam | 80:10:10; | 1 M H2SO4 | Cyclic voltammetry | 0–1.0 | 104 F g−1 at 30 mV s−1 | — | [15] |
| — | |||||||||
| Rice husk | Carbonization/KOH | Ni-foam | 90:5:5; | 6 M KOH | Cyclic voltammetry and galvanostatic charge/Discharge | 0–1.0 | 143 F g−1 at 5 mV s−1 and 147 F g−1 at 0.1 A g−1 | 85% | [16] |
| — | |||||||||
| Yellow pine | Oxygen plasma activation | Ni-foam | 85:0:15; | 6 M KOH | cyclic voltammetry | −1.0–1.0 | 171 F g−1 at 20 mV s−1 | — | [17] |
| 15 mg cm−2 | |||||||||
| Pine-apple leaf fiber | Hydrothermal and heat treatment/KOH | Ti foil | 80:10:10 | 1 M Na2SO4 | cyclic voltammetry | −0.2–0.8 | 131 F g−1 at 5 mV s−1 | 97% | This work |
| — |
aRatio by weight of active material:conducting carbon:binder; and mass loading (mg cm−2).
In this study we used PALFs to prepare porous activated carbon in three steps shown in figure 1. These three steps consist of the preparation of PALF biochar by the hydrothermal method in the aqueous solution of 1 M H2SO4, the chemical activation of PALF biochar by using KOH, and the heat treatment under argon atmosphere. The as-prepared porous carbon is referred to as PALF-AC. The chemical compositions, microstructure morphology, and electrochemical performances of the as-prepared samples were also determined.

Figure 1. Schematic illustration of the preparation of the porous carbon from pineapple leaf fiber.
Download figure:
Standard image High-resolution image2. Materials and methods
2.1. Materials and reagents
All reagents (except PALF-derived ACs) in the experiment were industrial grade, sodium hydroxide (NaOH; Sigma-Aldrich, USA), potassium hydroxide (KOH; Sigma-Aldrich, USA), polyvinylidene fluoride (PVDF; Aldrich, USA), N-methyl pyrrolidone (NMP; Sigma-Aldrich, USA), titanium foil (Ti 99.7%; Sigma-Aldrich, USA), sulfuric acid (H2SO4 98%; RCI Labscan, Thailand), hydrochloric acid (HCl 37%; RCI Labscan, Thailand), carbon black (Aldrich, USA), sodium sulfate (Na2SO4; Sigma-Aldrich, USA). These reagents were used without further purification.
2.2. Preparation of PALF with activated carbon
The fibers from pineapple leaves were prepared by cutting fresh pineapple leaves into a length of 5 mm and milling with a disc mill at a rotating speed of 7700 rpm [19]. In between a pair of circular plates, the samples were chopped and transferred to the hopper of the grinding machine. The operating speed of 25 000 rpm was used to grind the sample for 30 s, which produced the whole ground leaf (fibrous and non-fibrous components). After that, the fibrous part was separated from the sample using a stainless steel mesh number 60. Activated carbon was prepared according to the method modified from previously reported procedure [11]. Briefly, activated carbon was synthesized from carbonization and activation of the hydrothermal product of PALFs. PALF (1.5 g) was immersed in 60 ml of 1 M H2SO4 and was then transferred to 70 ml-teflon-lined stainless steel autoclave. The reactor was heated to 150 °C for 12 h and was left to cool down to room temperature. The obtained products were washed with DI water until pH 5.5–6.0 and were dried at 90 °C overnight. The obtained products, denoted as biochar, were chemically activated by potassium hydroxide (KOH) pellet. The biochar and KOH were ground and mixed together in agate mortar using 1:2 mass ratio. The mixtures were heated to 800 °C using heating rate of 5 °C min−1 and were kept at this temperature for 1 h under argon atmosphere. After that, the activated product was immersed in 1 M HCl overnight with continuous stirring to remove some impurities and was then washed with de-ionized water until pH 5.5–6.0. Finally, the resulting activated carbon was dried overnight in an oven at 100 °C.
2.3. Characterizations of materials
To determine the crystal structure, powder x-ray diffraction (XRD) patterns were collected using an x-ray diffractometer (PAN X'Pert, MDP) using the Cu-Kα radiation (λ = 1.5406 Å) at 40 kV voltage and 40 mA current. The phase identification of the as-synthesized carbon sample was recorded at 2θ range from 5° to 80°. The morphology and the elemental components of the porous carbon were analyzed using the field emission scanning electron microscope (JEOL JSM-7001F, Oxford Instrument) equipped with the x-ray energy dispersive spectrometer (EDS), and the high-resolution transmission electron microscope (HR-TEM, FEI TECNAI G2 20). In order to identify chemical states and elements present at the surface of the as-prepared powder, the x-ray photoelectron spectroscopy (XPS; Kratos) were used. All XPS spectra were collected using the C 1s and O 1s lines.
2.4. Electrochemical characterization
Electrochemical measurements were carried out using a conventional three-electrode cell, with Pt rod and Ag/AgCl electrode as counter and reference electrodes, respectively. The working electrode was prepared by mixing and grinding (in agate mortar) porous carbon, carbon black, and PVDF dissolved in NMP at a ratio 8:1:1 by weight. The slurry mixture was coated on the Ti foil in the area of 1 cm2 and was then dried in the oven at 90 °C for 24 h. The weight of dried slurry was about 2 mg. Cyclic voltammetry (CV) was performed on an Autolab potentiostat/galvanostat at different scan rates (5, 10, 20, 50, and 100 mV s−1) in 1 M Na2SO4 electrolyte solution. Additionally, the CV curves were recorded after CV aging of 50 cycles at a scan rate of 30 mV s−1. The electrochemical impedance spectroscopy (EIS) measurements were carried out in the frequency ranging from 100 kHz to 10 mHz at open circuit voltage with an AC perturbation of 10 mV.
3. Results and discussion
3.1. Characteristics of PALF with activated carbon
From the XRD pattern (see figure 2(a)), PALF with activated carbon (PALF-AC) exhibited amorphous nature. The diffraction patterns show two broad and low-intensity peaks at 2θ position of 25.4° and 43.4° that can be indexed to (0 0 2) and (1 0 0) spacing of the graphitized turbostratic carbon structure, respectively. The weak peaks suggest a low graphitization of the PALF-AC sample. This structure can be of 2D order created by parallel orientation of carbon layer planes [20]. Figure 2(b) shows the XPS survey spectrum of PALF-AC. There are only two main peaks at around 285.3 and 532.0 eV that correspond to C 1s and O 1s photoelectrons, respectively. These results demonstrate that the PALF-AC surface contained homoatoms of carbon. The deconvoluted C 1s spectrum of PALF-AC in figure 2(c) consists of four peaks at 284.4, 284.7, 286.0, and 288.8 eV, which are associated with C = C (sp2), C–C (sp3), and C–O and O–C=O, respectively [21, 22]. The carbon–carbon bondings (C–C and C = C bonds) are defined as 'CC,' whereas the carbon–oxygen bondings (C–O and O–C=O) are named 'CO.' The intensity ratio of CC/CO is higher than 1.0, indicating that oxygen-containing functional groups were removed from the carbon backbone after the heat treatment reduction process. Accordingly, the deconvoluted O 1s spectrum were also resolved into four peaks at 531.7, 532.8, 533.6, and 535.2 eV (figure 2(d)), which can be indexed as (A) oxygen in carbonyl groups, (B) oxygen atoms in hydroxyl or ethers, (C) oxygen in anhydride, lactone, or carboxylic acids, and (D) chemisorbed oxygen or water, respectively [23–25].
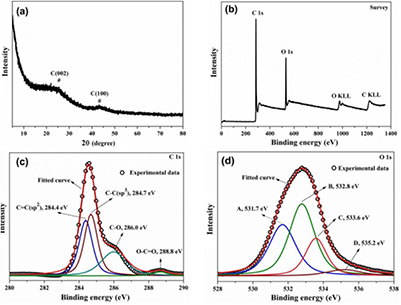
Figure 2. Powder XRD pattern (a), XPS survey spectrum (b), the deconvoluted XPS C 1s spectrum (c), and the deconvoluted XPS O 1s spectrum (d) of PALF-AC.
Download figure:
Standard image High-resolution image3.2. Surface morphology of PALF-AC
According to the field emission scanning electron microscopy (FESEM) images of low and high magnification (figures 3(a) and (b)), PALF-AC exhibited a highly interconnected 3D porous structure with very small sized pores (from 0.5 to 5 nm). The observed micropores and mesopores are spherical, ellipse, and polyhedral in shape with circularly interconnected between surface pores and internal pores. Chemical activation of carbon materials with KOH is thought to proceed as 6KOH + 2C → 3H2 + 2K + 2K2CO3, followed by decomposition of K2CO3 and/or of K, K2CO3, and CO2 [26]. The occurrence of the interconnected porous structures due to the KOH activation and the escape of the gas bubbles (H2(g), H2O(g), CO2(g) and CO(g)) during the heat treatment process have previously been discussed [27]. According to the results in this work, the KOH activation seems to generate a continuous network of homogeneous micro/mesopore structure throughout the PALF biochar surfaces in a fashion similar to other biomass-derived carbon products [11, 28]. The EDS spectrum in figure 3(c) shows the presence of C, O, and S with the atomic percentage of 89.71, 9.38, and 0.92, respectively. The high-resolution electron microscope (HR-TEM) image in figure 3(d) also revealed a highly interconnected continuous network of channels. The external and internal surfaces of the as-prepared sample are highly spaces and cavities which are supportive for the electron and ions transport to PALF-AC electrode during the electrochemical tests.
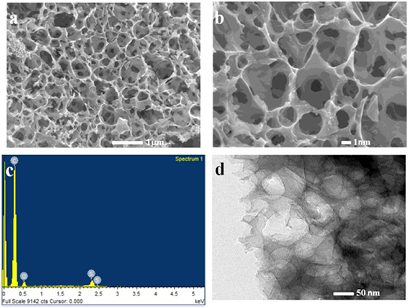
Figure 3. FESEM images at low magnification (a), high magnifications (b), EDS spectrum (c), and HR-TEM image of PALF-AC (d).
Download figure:
Standard image High-resolution image3.3. Electrochemical characteristics
To evaluate the electrochemical properties and performances of PALF-AC as a working electrode for SCs, CV measurement was conducted using three-electrode setup (Pt as a counter electrode and Ag/AgCl as a reference electrode) in 1 M NaSO4 aqueous electrolyte. Figure 4(a) exhibits the cyclic voltammograms (or CV curves) of as-prepared PALF-AC electrode at various scan rates from 5 mV s−1 to 100 mV s−1 within a potential window of −0.2 to 0.8 V (versus Ag/AgCl). All CV curves present an ideal supercapacitive behavior with nearly rectangular shapes without any redox peaks, which is characteristic of the EDLCs. The corresponding specific capacitance (Csp) of the PALF-AC electrode can be calculated by equation [28, 29]:
where  is the specific capacitance (F g−1), i is the response current on the CV curve (A),
  is the integration area of the CV curve,
  is the scan rate (V s−1),
  is the mass of active materials (g), and
  is the potential window of CV tests (V). The specific capacitance of the PALF-AC electrode were 81.3, 93.8, 103.8, 114.6, 120.3, 125.0, and 131.3 F g−1 at scan rates of 100, 70, 50, 30, 20, 10, and 5 mV s−1, respectively. When compared with most of other biomass-derived carbons, PALF-AC shows higher specific capacitance at the same scan rate (see table 1).
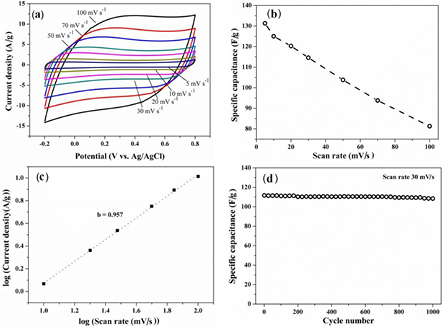
Figure 4. CV curves of PALF-AC over a scan rate range of 5–100 mV s−1 in 1 M Na2SO4 electrolyte solution (a), the specific capacitance (F g−1) versus scan rates (mV s−1) (b), the plot of log(current density) versus log(scan rate) or the dependence of discharge current density (at 0.3 V) on the scan rates (c), and cycling stability of PALF-AC electrode at a scan rate of 30 mV s−1.
Download figure:
Standard image High-resolution imageThe plots of specific capacitance versus scan rates show a common characteristic of electrochemical energy storage devices (figure 4(b)). A low scan rate exhibited a higher value of specific capacitance than at a higher rate because, at the low scan rate, the ions in the electrolyte can diffuse into the accessible pores of the PALF-AC electrode, allowing good interactions between ions and the porous carbon electrode to occur. At high scan rates, poor accessibility for the electrolyte ions then causes the specific capacitance to decrease [30]. In this work the PALF-AC electrode retained a good CV profile in nearly symmetrical rectangular shapes at both low (5 mV s−1) and high scan rates (100 mV s−1), suggesting that the PALF-AC electrode should have a high rate capability (figure 4(a)). The charge storage mechanism can be calculated by equation [31, 32]

where  is the peak current (mA),
  is the scan rate (mV s−1), and a and b are coefficients. The value b = 0.5 indicates a semi-finite diffusion-controlled process, whereas b = 1 indicates a capacitive behavior [32–34]. To understand the charge storage mechanism for the PALF-AC electrode in 1 M Na2SO4 electrolyte solution, we selected the discharge current density at 0.3 V from the cyclic voltammograms and plotted the log of discharge current density (A g−1) against the log of scan rate (mV s−1) as shown in figure 4(c). The linear range of the plot between 10 and 100 mV s−1 corresponds to b = 0.957, suggesting that the charge storage for the PALF-AC electrode in 1 M Na2SO4 occurs through fast, reversible electrostatic ion adsorption at the interface between the electrode and the electrolyte.
To investigate the long-term stability of the PALF-AC electrode, the capacitance retention was determined for 1000 CV cycles at the scan rate of 30 mV s−1. After 1000 continuous cycles, the specific capacitance of the PALF-AC electrode still remained at about 108.5 F g−1, or about 97% retention of its initial capacitance (figure 4(d)). We note that this level of cycling stability is outstanding particularly when compared with other biomass-derived carbon electrode. For example, the nanoporous carbon nanosheet derived from waste coffee grounds retained about 75.7% of its capacitance after 2000 CV cycles in 1 M Na2SO4 [35].
Figure 5 shows cyclic voltammograms of the PALF-AC electrode recorded at a scan rate of 30 mV s−1 for different cycle tests. From the 1st cycle to 1000th cycle, all CV curves remain unchanged from a quasi-rectangular shape profile with no significant difference in specific capacitance (figures 5(a)–(f)). These results suggest that the PALF-AC electrode has a good long-term stability, which bodes well for supercapacitor application.

Figure 5. CV cycling performance of the PALF-AC electrode (in 1 M Na2SO4) at constant scan rate of 30 mV s−1 for different cycles: (a) 1st, (b) 200th, (c) 400th, (d) 600th, (e) 800th and (f) 1000th cycle.
Download figure:
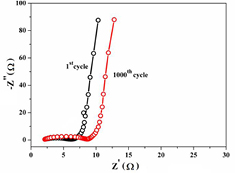
Standard image High-resolution imageTo further evaluate the supercapacitive performance of the PALF-AC electrode, the EIS after 1st and 1000th cycles were performed in the frequency range of 100 kHz to 10 mHz at open circuit voltage with an AC perturbation of 10 mV. The Nyquist plots of the PALF-AC electrode during the cycle life testing are presented in figure 6. In the high frequency region, the intercept of the real part (Z') corresponds to the combination of the resistance (or Rs) of 1 M Na2SO4 electrolyte solution, the intrinsic resistance of PALF-AC, and the contact resistance between PALF-AC and Ti foil substrate. Rs values for 1st and 1000th cycles are nearly the same at 2.13 Ω. The distortion from a small semicircle at the high-frequency region as a result of the porosity of the electrode surface can be described as the charge transfer resistance (Rct) from the surface containing oxygen groups, while the roughly linear part at the low-frequency region is due to the diffusive resistance or Warburg impedance (W) of the ions in the pores of the electrode [36]. Rct values for the 1st and the 1000th cycles are 3.91 and 5.90 Ω, respectively. The increase in Rct is probably due to the loss of some active materials from the surface of the current collector. The near vertical line also suggests an ideal capacitive behavior of the device [32]. The near linear line of Warburg impedance for both 1st and 1000th cycles also reaffirms that the PALF-AC electrode possesses good capacitive properties.
Figure 6. Nyquist plots of the PALF-AC electrode in the frequency ranging from 100 kHz to 10 mHz at open circuit voltage with an AC perturbation of 10 mV. The EIS measurements were recorded during the cycle stability testing.
Download figure:
Standard image High-resolution image
4. Conclusions
In summary, this study presents the conversion of agro-waste biomass into high-performance energy storage material. Using hydrothermal, KOH activation and carbonization processes, the low-cost PALF yielded highly porous activated carbon with 3D continuous network of homogeneous micro/mesopore structure. Because of the outstanding nanostructure, morphology, and surface characteristics, PALF-AC exhibited good electrocapacitive performance with specific capacitance of 131.3 F g−1 at a scan rate of 5 mV s−1 within a voltage range of −0.2 to 0.8 V in 1 M Na2SO4 electrolyte solution. Moreover, PALF-AC also showed excellent capacitive retention, dropping only 3% of the initial capacitance after 1000 cycles. This promising capacitive performance along with the sustainable nature of the material demonstrates that the PALF-AC electrode has great potential for large-scale supercapacitor application.
Acknowledgments
This work was financially supported by the Faculty of Applied Science and Engineering, Khon Kaen University, Nong Khai Campus. This study was also supported by the Department of Chemistry, the Center of Sustainable Energy and Green Materials, and the Center of Excellence for Innovation in Chemistry, Faculty of Science, Mahidol University.
Footnotes
- *
Invited talk at 5th Thailand International Nanotechnology Conference (Nano Thailand-2016), 27–29 November 2016, Nakhon Ratchasima, Thailand.