

Abstract
Synthesis of silver nanoparticles (AgNPs) under different physicochemical conditions like concentration of silver nitrate (AgNO3), pH and temperature, using fungal cell filtrate of Aspergillus oryzae (MTCC No. 1846) and its antibacterial properties were demonstrated. When fungal cell filtrate having neutral pH was exposed to different concentrations of aqueous solution AgNO3 (1–10 mM), formation of stable AgNPs of different sizes was observed. The size of the AgNPs decreased with the increase of AgNO3 concentration from 1 mM to 8 mM, however, the particles size increased with the increase of AgNO3 concentration from 9 mM to 10 mM. When fungal cell filtrate exposed to aqueous solution of 1 mM AgNO3 at different pH (4–10), the silver ions (Ag+) were reduced leading to the formation of stable AgNPs of different sizes. The size of the AgNPs decreased with the increase of alkaline conditions. When aqueous solution of 1mM AgNO3 with fungal cell filtrate, having neutral pH, was exposed to different temperatures (10, 30, 50, 70 and 90 °С), formation of stable AgNPs having different sizes were obtained. The size of the AgNPs decreased with the increase of temperature. Synergetic effect with antibiotics and size dependent antibacterial activities were also demonstrated against Escherichia coli (MTCC 1687), Staphylococcus aureus (MTCC 737), Bacillus subtilis (MTCC 441) and Klebseilla pneumoniae (MTCC 4030). The formation AgNPs was characterized by UV–vis spectrophotometer. Transmission electron microscope (TEM) confirmed the sizes of the obtained nanoparticles. X-ray diffractometer (XRD) spectrum confirmed the formation of metallic silver. The Fourier transform infrared spectroscopy (FTIR) confirmed the presence of protein as stabilizing agent around AgNPs. Scanning electron microscope (TEM) confirmed the morphological changes in the treated bacterial organisms.
Export citation and abstract BibTeX RIS

Original content from this work may be used under the terms of the Creative Commons Attribution 3.0 licence. Any further distribution of this work must maintain attribution to the author(s) and the title of the work, journal citation and DOI.
1. Introduction
Nanoparticles and nanostructured materials deals with matters of nanometer scale ranging approximately from 1 to 100 nm, which forms the fundamental building blocks of nanotechnology for various applications. They exhibit size-dependent properties when compared with larger particles of the same material. The increase in surface area to volume affects the optical, mechanical, thermal and catalytic properties of nanoparticles. They have been studied extensively for catalytic activity, optical properties, electronic properties, antibacterial properties, magnetic properties, bio-labeling, treatment of cancer and nanofabrication [1–10]. The use of physical and chemical methods for the synthesis of silver nanoparticles involves toxic chemicals, high temperature, and pressure and is expensive. The use of biological route for synthesis of silver nanoparticles provides a reliable, nontoxic, clean ecofriendly, and green experimental protocols for the synthesis of nanoparticles [11]. Since the unique physiochemical properties of silver nanoparticles depend on their sizes and shapes, size control synthesis of nanoparticles is an emerging area of research. In the present study, the effect of different reaction conditions on the rate of synthesis of nanoparticles and its morphology using the fungal filtrate of Aspergillus oryzae (MTCC No. 1846) and their antibacterial activities were investigated.
2. Material and methods
2.1. Selection of the organisms
2.1.1. Selection and maintenance of the fungi for biosynthesis of silver nanoparticles.
Silver nanoparticle synthesis was studied using the mould Aspergillus oryzae (MTCC No.1846). The pure cultures were obtained from Institute of Microbial Technology (IMTECH), Chandigarh, India. The mould A. oryzae was maintained at 25 °C on Czapex dox agar. The fungal strains were inoculated in the autoclaved media at 15 lb inch−2 for 30 min under sterilized conditions using an Erlenmeyer flask of 100 ml capacity and cooled to room temperature before use. The inoculums were allowed to grow for 7–8 d at 25 °C until a circular mycelium was seen on the surface. The pH of the medium was 5.6. Subcultures were done after 15 d of growth.
2.1.2. Selection and maintenance of the bacterial strains.
To study the antibacterial properties of silver nanoparticles on bacterial cells, four bacterial strains, Escherichia coli (MTCC 1687), Staphylococcus aureus (MTCC 737), Bacillus subtilis (MTCC 441) and Klebseilla pneumoniae (MTCC 4030) were used. The pure cultures were obtained from Institute of Microbial Technology (IMTECH), Chandigarh, India. The four bacterial strains were maintained on nutrient broth (NB) at 37 °C. An Erlenmeyer flask of 50 ml capacity was used for growing the bacterial culture. The bacterial strains were inoculated in the autoclaved media under sterilized conditions at 15 lb inch−2 for 30 min, cooled to room temperature before use and were allowed to grow for 24 h at 37 °C. The pH of the medium was 7.5. Subcultures were done after 24 h of growth.
2.1.3. Biomass production.
The fungal biomass was prepared by growing it aerobically in liquid broth of Czapex dox broth (g l−1). Erlenmeyer flasks of 250 ml capacity containing 100 ml of the media were used. The fungal strain was inoculated in the autoclaved media under sterilized and static conditions. The inoculums were allowed to grow for 3–4 d at 25 °C. The medium were autoclaved at 15 lb inch−2 for 30 min and cooled to room temperature before use. The pH of the medium was 5.6.
2.1.4. Production of fungal culture filtrates for synthesis of silver nanoparticles.
For the production of the fungal culture filtrate, the fungal biomass of A. oryzae grown for 3–4 d was harvested and extensively washed by using sterile double distilled water. A solution of 10 g (wet weight) of the respective fungus and 200 ml of sterile double distilled water was incubated at 27 °C in dark using Erlenmeyer flask for 5 d and filtered by passing it through Whatman filter paper No. 1. The culture filtrate of A. oryzae with pH 7.3 was obtained.
2.2. Effect of different parameter on the synthesis of silver nanoparticles using fungal cell filtrate
2.2.1. Effect of silver nitrate concentration.
Different concentrations of aqueous solution of AgNO3 ranging from 1 to 10 mM were added to each test tubes containing fungal culture filtrate at neutral pH under dark condition at room temperature.
2.2.2. Effect of pH.
To determine the effect of pH on the rate of synthesis of nanoparticles and particles morphology, 1 mM concentration of AgNO3 were added to different test tubes containing fungal culture filtrate adjusted to different pH ranges (4–10) using 1 M HNO3 and 1 M NaOH and incubated at room temperature under dark condition.
2.2.3. Effect of temperatures.
To determine the effect of temperature on the rate of synthesis of nanoparticles and particles morphology, 1 mM AgNO3 were added to the fungal culture filtrates having neutral pH taken in different test tubes and incubated at different temperatures (10 °C, 30 °C, 50 °, 70 °C and 90 °C).
2.3. Antibacterial activity
2.3.1. Antibacterial activities of silver nanoparticles.
To study the size dependent antibacterial properties of biosynthesized AgNPs against the test organisms (E. coli, S. aureus, B. subtilis and K. pneumoniae), disk diffusion method was performed according to the procedure followed by Ruparelia et al [12]. Filter paper disks (~5 mm diameter) were impregnated on with different sizes AgNPs (7.22 nm ± 3.07 nm, 17.06 nm ± 5.78 nm and 62.12 nm ± 31.5 nm of 20 µg ml−1) and were placed on Muller-Hinton agar plate having bacterial cells population of about 104 to 105 CFU ml−1. The culture plates were then incubated at 35 °C for 24 h and the zone of inhibition (ZoI) was measured.
2.3.2. Estimation of total protein leakage from bacterial cell.
Estimation of the total protein leakage from the treated and untreated bacterial cells (E. coli, S. aureus, B. subtilis and K. pneumoniae) with biosynthesized AgNPs with different sizes (7.22 nm ± 3.07 nm, 17.06 nm ± 5.78 nm and 62.12 nm ± 31.5 nm) was done using Bradford's protein assay according to the procedure followed by Lee et al [13]. Ag-NPs (50 µg ml−1) of different sizes (7.22 nm ± 3.07 nm, 17.06 nm ± 5.78 nm and 62.12 nm ± 31.5 nm) and bacterial cells population of about 104 to 105 CFU ml−1 were used for the study. The bacterial cultures were incubated with and without different sizes nanoparticles in a shaking incubator at 37 °C for 6 h. From each culture, 3 ml of the culture was taken and centrifuged at 4 °C for 30 min at 300 g. The obtained supernatant from each culture was frozen at –20 °C and was further treated with Bradford's assay reagent for protein estimation. The optical density (OD) was measured at 595 nm.
2.3.3. Synergistic effect of silver nanoparticles with antibiotics.
Disk diffusion method was used to assay the synergistic effect of antibiotics with extracellularly biosynthesized AgNPs for bactericidal activity against test strains (E. coli, S. aureus, B. subtilis and K. pneumoniae) on Muller-Hinton agar plates. To investigate the synergistic effects, each paper disk (~5 mm diameter) was impregnated with different antibiotics (ampicillin, chloramphenicol, streptomycin and tetracycline) having concentration 15 µg ml−1 which was further impregnated with the biosynthesized AgNPs (15 µg ml−1) having an average size of about 7.22 nm ± 3.07 nm. For the study, 1 ml of each test strains (E. coli. S. aureus, B. subtilis and K. pneumoniae) were applied to the agar plates along with the prepared disks which were taken from 24 h overnight grown culture in nutrient broth liquid medium on a rotary shaker (200 rpm) at 35 °C. After incubation at 35 °C for 24–48 h, the zones of inhibition were measured.
2.3.4. Morphological changes in bacterial cells treated with silver nanoparticles.
Scanning electron microscope (SEM) was used to observe the morphological changes of bacterial cells surface treated or not with AgNPs having average particles sizes of about 7.22 nm ± 3.07 nm. For the study, 2 ml of the bacterial cultures (E. coli, S. aureus, B. subtilis and K. pneumoniae) having bacterial cells population of about 104 to 105 CFU ml−1 from 24 h overnight grown culture were centrifuged and treated with AgNPs (50 µg ml−1) for 6 h. After treatment, they were centrifuged at 300 g for 30 min. The pellets were collected and treated according to the standard procedure followed SAIF, NEHU, Shillong, for SEM analysis.
2.4. Characterization of synthesized silver nanoparticle
The localized surface plasmon resonance of silver nanoparticles (AgNPs) was characterized by using UV–Vis spectrophotometer (PC Based Double Beam Spectrophotometer, 2202, Systronic). The size and morphology of silver nanoparticles was characterized by transmission electron microscope (TEM) (JEOL JEM 100CX II). The morphology of the bacterial cells treated with silver nanoparticles was examined using scanning electron microscope (SEM) (JSM-6360). The presence of elemental silver was confirmed through x-ray diffraction (XRD) analysis (D8 ADVANCE, BRUKER). The interaction between protein–silver nanoparticles was analyzed by Fourier transforms infrared spectroscopy (FTIR, BRUKER Vector 22 Spectrophotometer). Determination of the concentration of silver nanoparticles was done using Graphite Furnace (ANALYTIKJENA AG VARIO 6).
3. Result and discussion
3.1. Effect of silver nitrate concentration
The fungal culture filtrate of A. oryzae exhibited a gradual change in colour from light yellowish to brown, when it was incubated with aqueous solution of AgNO3 in the ranges 1–10 mM in dark at 27 °C within 12 h of reactions, which further got darkened with increased in the incubation time as shown in supplementary figure 1. The change in colour of the filtrate demonstrated the surface plasmon resonance (SPR) of the biosynthesized AgNPs [14]. The formation of the AgNPs may be due to the responsible protein present in the fungal culture filtrate, which may acts as the reducing agent. The possibility of the enzyme nitrate reductase has been reported in our earlier study [15]. The absorbance peaks shift towards the UV range with increase in AgNO3 concentration from 1–8 mM, however it shifted towards the visible range when the concentration of AgNO3 was increased from 9–10 mM as shown in figure 2, which reflect the size of the silver nanoparticles. The absorbance peaks shift towards the UV-regions as the size of the particles decreased but it shifts towards visible region with increase in large sizes [16]. The particles sizes increased with increased in concentrations of AgNO3 from 1–8 mM, beyond which, large particles were formed, which was revealed by TEM as shown in the figure 3. The average sizes of silver nanoparticles and their ranges synthesized by using culture filtrate of A. oryzae at different concentrations of AgNO3 (1–10 mM) is given in table 1. The histogram shows size-based distribution of the AgNPs synthesized by culture filtrate of A. oryzae at different concentrations of AgNO3 (1–10 mM) as shown in supplementary figure S1 (stacks.iop.org/ANSN/8/045016/mmedia). These observations indicate that the size of AgNPs can be modulated by the concentration of silver nitrate (AgNO3). The amount of extracellular proteins secreted by the fungal biomass might play an important role in the reduction process. Increasing the metal concentration initially resulted in synthesis of smaller particles due to availability of different functional groups for the reaction; however larger particles were formed at higher concentration of metal which may be due to non-availability of functional groups responsible for the reduction reaction. Report on the amount of extracellular proteins secreted by the fungal cell depending on their biomass responsible for rapid synthesis of nanoparticles was reported [17]. Early report on the effect of the amount of functional groups present in the Coleus aromaticus leaf extract for synthesis of silver nanoparticles at different metal concentration (1–5 mM) has been documented [18]. The effect on the size of the nanoparticles obtained, with the increase in silver nitrate concentration by using fungal cell filtrate of Penicillium sp was reported [19]. When the concentration of aqueous silver nitrate solution was increased from 0.5 mM to 2 mM, the optimal concentration was found to be 1 mM and when the concentration was increased to 2 mM, it resulted in the formation of large sized nanoparticles. Similar observations on size dependent synthesis of silver nanoparticles using different concentration of silver nitrate (1–10 mM) was reported using the supernatant of E. coli strain, DH5 [20]. Transmission electron microscope (TEM) revealed that with increase in silver nitrate concentration up to 5 mM, the particles sizes decreased, however the sizes of the silver nanoparticles gets altered beyond 5 mM concentration. The reason for the decrease in particle size with increasing AgNO3 concentration is not clear; however it was reasoned that it may be due to AgNO3 which forms a coat on growing particles and may prevent their aggregation and, thus, yielding particles of nanoscale size.
Table 1. Silver nanoparticles of different size and its ranges synthesized in culture filtrate of A. oryzae under different concentrations of AgNO3 (1–10 mM).
| Different concentration of AgNO3 (mM) | Absorbance peak (nm) | Average AgNPs size (nm) | Particle size ranges (nm) |
|---|---|---|---|
| 1 | 420 | 17.06 ± 5.78a | 7–27 |
| 2 | 420 | 16.25 ± 5.73b | 7–26 |
| 3 | 418 | 14.83 ± 7.04c | 5–28 |
| 4 | 416 | 12.09 ± 6.187d | 4–26 |
| 5 | 415 | 10.83 ± 6.671e | 3–23 |
| 6 | 415 | 9.57 ± 5.136f | 3–18 |
| 7 | 413 | 7.77 ± 3.929g | 3–15 |
| 8 | 410 | 7.22 ± 3.07h | 3–12 |
| 9 | 455 | 45.93 ± 22.81i | 14–96 |
| 10 | 473 | 62.12 ± 31.5j | 16–105 |
Note: Mean value of three replicates with SD is presented with different letters in the same column show a significant difference at α = 0.05 levels based on Duncan's multiple range tests. The different letters signifies that the value (particles size) of different rows of the same column are significantly different from each other. With different concentration of AgNO3,the synthesized AgNPs sizes varies. That variant is significant.
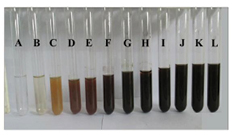
Figure 1. Fungal culture filtrates of A. oryzae, with different concentration of AgNO3 showing intensity of colour change with increase in AgNO3 concentrations: (A) 1 mM AgNO3 solution; (B) fungal culture filtrate, and culture filtrate with different concentrations of AgNO3: (C) 1 mM, (D) 2 mM, (E) 3 mM, (F) 4 mM, (G) 5 mM, (H) 6 mM, (I) 7 mM, (J) 8 mM, (K) 9 mM and (L) 10 mM.
Download figure:
Standard image High-resolution image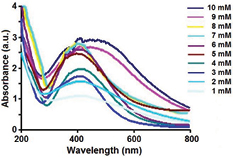
Figure 2. UV–vis absorbance spectra of silver nanoparticles synthesized in culture filtrate of A. oryzae under different concentrations of AgNO3 from 1 mM to 10 mM.
Download figure:
Standard image High-resolution image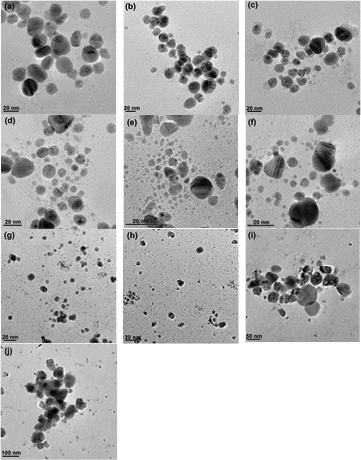
Figure 3. TEM micrographs of silver nanoparticles synthesized in culture filtrate of A. oryzae under different concentrations of AgNO3: (a) 1 mM, (b) 2 mM, (c) 3 mM, (d) 4 mM, (e) 5 mM, (f) 6 mM, (g) 7 mM, (h) 8 mM, (i) 9 mM and (j) 10 mM.
Download figure:
Standard image High-resolution image3.2. Effect of pH
To study the effect of pH on the morphology and rate of synthesis of silver nanoparticles, 1 mM AgNO3 was added to the fungal culture filtrate of A. oryzae adjusted to different pH ranges (4–10) and the reaction was carried out in dark at 27 °C.The reaction mixture exhibited a gradual change in colour from light yellowish to brown within 12 h of reactions which further got darkened with increased incubation period time as shown in figure 4. The change in colour of the filtrate demonstrated the surface plasmon resonance (SPR) of the biosynthesized AgNPs [14]. The formation of the AgNPs may be due to the responsible protein present in the fungal culture filtrate, which may acts as the reducing agent. The possibility of the enzyme nitrate reductase has been reported in our earlier study [15]. When the pH was increased from 4 to 10, maximum synthesis was observed at pH 10 and the time taken was reduced to 30 min. No synthesis was observed in pH range 4–5, whereas synthesis of AgNPs occurred with respect to pH in the range 6–10, which was reflected with an increase in the absorbance peak. These observations indicate that alkaline condition is necessary for the reduction of metal ions. The presence of hydroxide ions increased the reduction capacity of the proteins involved in the reduction process, which might act as a reducing agent to carry out the reduction reaction of metal ions. The absorbance peak shifted towards the UV region with increase in pH as shown in figure 5, which reflect the size of the silver nanoparticles synthesized. The absorbance peaks shift towards the UV-regions as the size of the particles decreased but it shifts towards visible region with increase in large sizes [16]. The size of the particles decreases with increase in pH and were found to be more uniform in sizes almost spherical in shape which was revealed by TEM, as shown in the figure 6. The average particles size and its sizes ranges obtained at different pH reaction conditions, using culture filtrate of A. oryzae is given in table 2. Histogram of size-based distribution of the silver nanoparticles, synthesized by culture filtrate of A. oryzae at different concentrations of AgNO3 (1–10 mM) was shown in figure S2 (supplementary). Similar observations were reported earlier where alkaline condition was found to be effective for rapid reduction of metal ions by Coriolus versicolor and Escherichia coli [21, 22]. The possible mechanism of smaller size synthesis of SNPs under alkaline condition is due to the reduction of silver ions by electrons provided by OH− ions. The size of the particles decreased with increase in alkaline condition may be related to the growth of the silver nanoparticles nucleus, whereas at lower pH, nucleation occurs, resulting in silver nanoparticles synthesis were favored [22].
Table 2. Silver nanoparticles of different size and its ranges synthesized in culture filtrate of A. oryzae under different pH conditions (4–10).
| pH | Absorbance peak (nm) | Average AgNPs size (nm) | Particle size ranges (nm) |
|---|---|---|---|
| 4 | — | — | — |
| 5 | — | — | — |
| 6 | 428 | 17.4 ± 9.11a | 5–33 |
| 7 | 424 | 16.84 ± 6.98b | 7–28 |
| 8 | 412 | 14.44 ± 5.83c | 5–23 |
| 9 | 412 | 9 ± 2.64d | 5–13 |
| 10 | 410 | 7.11 ± 2.93e | 3–12 |
Note: Mean value of three replicates with SD is presented with different letters in the same column show a significant difference at α = 0.05 levels based on Duncan's multiple range tests. The different letters signifies that the value (particles size) of different rows of the same column are significantly different from each other. With different pH conditions,the synthesized AgNPs sizes varies. That variant is significant.

Figure 4. Fungal culture filtrates of A. oryzae with 1mM AgNO3, under different pH conditions, showing intensity of colour change with increase in pH: (A): 1mM AgNO3 solution, (B): fungal culture filtrate, and culture filtrate with 1 mM AgNO3 at different pH values: (C) pH 4, (D) pH 5, (E) pH 6, (F) pH 7, (G) pH 8, (H) pH 9 and (I) pH 10.
Download figure:
Standard image High-resolution image
Figure 5. UV–vis absorbance spectra of silver nanoparticles synthesized in culture filtrate of A. oryzae under different pH conditions.
Download figure:
Standard image High-resolution image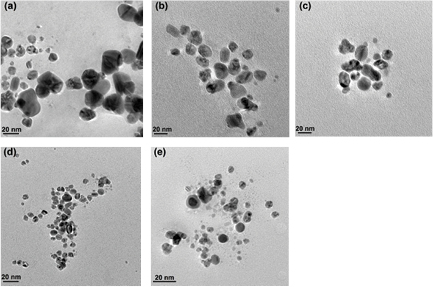
Figure 6. TEM imagess of silver nanoparticles synthesized in culture filtrate of A. oryzae under different pH conditions: (a) pH 6, (b) pH 7, (c) pH 8, (d) pH 9 and (e) pH 10.
Download figure:
Standard image High-resolution image3.3. Effect of temperature
To study the effect of temperature, on the morphology and rate of synthesis of silver nanoparticles, the reaction mixture containing the fungal culture filtrate of A. oryzae (neutral pH) with aqueous solution of 1 mM AgNO3, were taken in different test tubes and were exposed to different temperatures, namely, 10 °C, 30 °C, 50 °C, 70 °C and 90 °C. The reaction mixture exhibited a gradual change in colour from light yellowish to brown within 12 h of reactions, which further got darkened with increased in incubation period as shown in figure 7. The change in colour of the filtrate demonstrated the surface plasmon resonance (SPR) of the biosynthesized AgNPs [14]. The formation of the AgNPs may be due to the responsible protein present in the fungal culture filtrate, which may act as the reducing agent. The rate of reaction increased with decrease in time as the reaction temperature was increased from 30 °C to 90 °C. At 30 °C, the reaction occurred within 6 h, at 50 °C, it occurred within 1 h, at 70 °C, it occurred within 45 min, where as it occurred within 20 min only at 90 °C, as confirmed by increase in absorbance peak, however, there was no synthesis at 10 °C which was reflected with no absorbance peak. The rate of synthesis of nanoparticles increased with increase in temperature and the absorbance peak shifted towards the UV region with increase in temperature as shown in figure 8, which reflects the sizes of the silver nanoparticles synthesized. The sizes of the biosynthesized silver nanoparticles decreased with increase in reaction temperature and were more uniform in sizes, almost spherical in shape as shown in figure 9, which was revealed by TEM. The average size of the silver nanoparticles and its size ranges, obtained at different reaction temperature conditions (10 °C–90 °C), using culture filtrate of A. oryzae is given in table 3. Histograms of size-based distribution of silver nanoparticles synthesized by A. oryzae at different reaction temperature conditions were shown in figure S3 (supplementary). Similar observation was reported recently regarding the role of free amino acids in the non-enzymatic synthesis of silver nanoparticles by Fusarium oxysporum [17]. The fungal culture filtrate after been exposed to high temperature to denature the possible enzymes and proteins present in the fungal filtrate, could still synthesize silver nanoparticles from AgNO3. Similar observation on decrease in particle size with increase of temperature was reported earlier in case of Trichoderma viride [22] and E. coli [20], however in case of E. coli, there was slight increase in particle size beyond 60 °C which may be due to aggregation of small nanoparticles. High temperature may favor formation of smaller silver nanoparticles by reducing the extent of aggregation of the nanoparticles due to increase in the rate of adsorption of silver nitrate (AgNO3) and the viscosity of the coat-phase [20]. The decrease in particles size with higher temperature may also be due to increase in reaction rate, leading in the formation of nuclei from the silver ions and preventing the secondary reduction process on the surface of the pre-formed nuclei [23].
Table 3. Silver nanoparticles of different sizes and its ranges synthesized in culture filtrate of A. oryzae under temperature (°C) conditions (10–90 °C).
| Temperature (°C) | Absorbance peak (nm) | Average AgNPs size (nm) | Particles size ranges (nm) |
|---|---|---|---|
| 10 | — | — | — |
| 30 | 420 | 13.9 ± 5.043a | 7–24 |
| 50 | 416 | 10.18 ± 3.65b | 5–17 |
| 70 | 413 | 8.57 ± 2.87c | 5–13 |
| 90 | 401 | 6.8 ± 1.92d | 4–9 |
Note: Mean value of three replicates with SD is presented with different letters in the same column show a significant difference at α = 0.05 levels based on Duncan's multiple range tests. The different letters signifies that the value (particles size) of different rows of the same column are significantly different from each other. With different temperature conditions, the synthesized AgNPs sizes varies. That variant is significant.

Figure 7. Fungal culture filtrates of A. oryzae with 1mM AgNO3, under different temperature conditions, showing intensity of colour change with increase in temperature: (A) 1 mM AgNO3 solution, (B) fungal culture filtrate, and cell filtrate with 1mM AgNO3 at different temperatures: (C) 10 °C, (D) 30 °C, (E) 50 °C, (F) 70 °C and (G) 90 °C.
Download figure:
Standard image High-resolution image
Figure 8. UV–vis absorbance spectra of silver nanoparticles synthesized in culture filtrate of A. oryzae under different temperatures conditions.
Download figure:
Standard image High-resolution image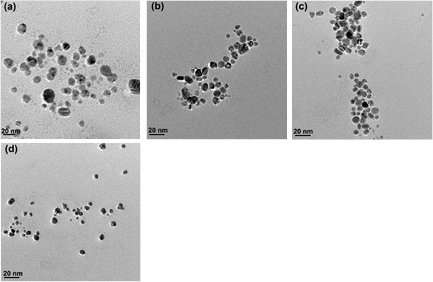
Figure 9. TEM micrographs of silver nanoparticles synthesized in culture filtrate of A. oryzae under different temperatures: (a) 30 °C, (b) 50 °C, (d) 70 °C and (e) 90 °C.
Download figure:
Standard image High-resolution image3.4. XRD analysis
The XRD pattern of biosynthesized AgNPs, showed four intense peaks in the whole spectrum of 2 theta values ranging from 35 to 80 as shown in figure 10. The 2 theta peak values of around 38.12°, 44.46°, 64.65° and 77.46° were observed corresponding to (1 1 1), (2 0 0), (2 2 0) and (3 1 1), respectively for silver, which confirmed the face centered cubic (fcc) structure of the synthesized AgNPs when compared with the standard.

Figure 10. XRD pattern of silver nanoparticles synthesized by A. oryzae.
Download figure:
Standard image High-resolution image3.5. FTIR analysis
The nanoparticles synthesized by the fungal cell filtrate were not in direct contact, indicating stabilization of the nanoparticles by a capping agent which was confirmed by FTIR analysis in our earlier finding [15]. The FTIR spectrum of silver nanoparticles showed eight distinct peaks: 1116, 1457, 1629, 2361, 2853, 2923 and 3421 cm−1. The peak at 3421 cm−1 refers to NH stretch vibration of primary amines. The peak at 2923 and 2853 cm−1 refer C–H asymmetrical stretch vibration and C–H symmetrical stretch vibration of alkanes. The peaks at 2361 cm−1 and 1629 cm−1 refer to C=O and C=C stretch. The peak at 1457 cm−1 refers to C=N stretches while the peak at 1116 cm−1 refers to C–C stretches. It has been reported that the carbonyl groups of the amino acid residues and the peptides have strong ability to bind to the silver [24]. It is also been reported that the proteins can bind to nanoparticles either through free amine or cysteine groups in proteins [25, 26]. The proteins present over the AgNPs surface may acts as capping agent for stabilization of the nanoparticles.
3.6. Antibacterial activity of silver nanoparticles
Size dependent antibacterial activities of AgNPs were studied against four bacterial strains E. coli, S. aureus, B. subtilis and K. pneumoniae. AgNPs with three different average sizes of 7.22 nm ± 3.07 nm, 17.06 nm ± 5.78 nm and 62.12 nm ± 31.5 nm were selected for size dependent antibacterial activity against the four pathogenic bacterial strains. AgNPs (20 µg ml−1) with above-mentioned three different average sizes, were impregnated on filter paper disks (~5 mm diameter) and placed on an Muller-Hinton agar plate having uniform bacterial cells population (E. coli, S. aureus, B. subtilis and K. pneumoniae) of about 104 to 105 CFU ml−1 and incubated at 37 °C for 24 h. The zone of inhibition obtained in the petri discs were measured. AgNPs having an average size of 7.22 nm ± 3.07 nm, showed maximum antibacterial activity against the four bacterial strains, followed by nanoparticles having an average size of 17.06 nm ± 5.78 nm and the minimum was showed by the nanoparticles with an average size of 62.12 nm ± 31.5 nm as shown in figure 11. AgNPs having smaller sizes was found to be more effective as antibacterial against the test organisms. Amongst the four bacterial strains tested, the maximum antibacterial activity against the nanoparticles was shown by K. pneumoniae, followed by E. coli, B. subtilis and the least activity was observed in S. aureus as shown in table 4. The two gram negative bacterial strains, K. pneumoniae and E. coli were found to be more sensitive to AgNPs than the other two gram positive bacterial strains, B. subtilis and S. aureus. The gram positive bacteria are less susceptible to Ag+ than gram negative bacteria because of thicker cell walls due to the presence of more peptidoglycan, which is negatively charged and can bind positively charged silver ions, which get trapped by peptidoglycan in gram positive bacteria than in gram negative bacteria [27]. The possible reason for maximum antibacterial activity shown by smaller particles may be due to efficient binding because of large surface area and could penetrate the cell wall due to its small size. Similar observation on size dependent antibacterial activity of AgNPs was reported earlier [28, 29]. The small sized particles affect a large surface area of the bacteria and therefore are more effective as antibacterial than large sized particles [18]. Due to its large surface area, it can interact with the cell membrane and can disturb the cell function such as permeability, respiration, and eventually leads to cell death. The generation of reactive species inside the bacterial cells due to AgNPs, leading to cell death was also reported earlier [30]. The affinity of AgNPs to react with phosphorus and sulphur compounds present inside the bacterial cell membrane as well as DNA, resulting in bacterial death was also reported earlier [31]. The possible mechanisms for the antibacterial activity of AgNPs may be due to the electrostatic interaction [32]. Early reports on antibacterial activities of silver ions states that silver ions can inhibit DNA replication, leading to the cell death as well as inactivates proteins by binding with its thiol group [33, 34].
Table 4. Size dependent antibacterial activity of silver nanoparticles against the four test bacterial strains.
| Bacterial strains | Zone of inhibition (mm) | |||
|---|---|---|---|---|
| DW | AgNP size 7.22 nm ± 3.07 nm | AgNP size 17.06 nm ± 5.78 nm | AgNP size 62.12 nm ± 31.5 nm | |
| K. pneumoniae | — | 19 ± 0.57 | 14 ± 1 | 9 ± 1 |
| E. coli | — | 15 ± 1.15 | 11 ± 1 | 9 ± 1 |
| B. subtilis | — | 13 ± 0.57 | 10 ± 0.57 | 6 ± 1 |
| S. aureus | — | 8 ± 1 | 6 ± 1 | 4 ± 0.57 |
DW: distilled water, AgNPs concentration is 20 µg ml−1.

Figure 11. Size dependent antibacterial activities of silver nanoparticles against the four test bacterial strains (DW: distilled water).
Download figure:
Standard image High-resolution image3.7. Estimation of total protein leakage from bacterial cell membrane
The effect of different size AgNPs on total protein leakage from the bacterial cell membrane against four bacterial strains (E. coli, S. aureus, B. subtilis and K. pneumoniae) was tested. Bacterial cells population having concentration of 105 CFU ml−1 were incubated along with AgNPs (50 µg ml−1) having different average sizes of 7.22 nm ± 3.07 nm, 17.06 nm ± 5.78 nm and 62.12 nm ± 31.5 nm in a shaking incubator at 37 °C for 6 h. After 6 h of incubation, protein leakage from the tested bacterial cells treated with AgNPs considerably increased when compared with the control as given in table 5. Maximum total protein leakage from cell of the four bacterial strain was observed with bacterial cells treated with AgNPs having an average size of 7.22 nm ± 3.07 nm, which was followed by bacterial cells treated with AgNPs having an average size of 17.06 nm ± 5.78 nm and the bacterial cells treated with AgNPs having an average size of 62.12 nm ± 31.5 nm. The AgNPs with an average sizes of 7.22 nm ± 3.07 nm was found responsible for maximum total protein leakage from all the four test bacterial strains. Maximum total protein leakage was observed in E. coli, followed by K. pneumoniae, B. subtilis and S. aureus. Maximum total protein leakage was found to be much higher in treated bacterial cells than untreated cells, indicating that the AgNPs might increase membrane permeability. The gram negative bacterial strains were found to be more sensitive to AgNPs than the gram positive bacterial strains, which may be due to the differences in the nature of the bacterial cell wall, because of the presence of more peptidoglycan layer in case of gram positive compared to gram negative bacteria. Bacterial cells treated with AgNPs having an average size of 7.22 nm ± 3.07 nm showed significantly higher total protein leakage than that from cells treated with AgNPs having an average size of 17.06 nm ± 5.78 nm and 62.12 nm ± 31.5 nm. Maximum activity was shown by AgNPs having an average size of 7.22 nm ± 3.07 nm, which is due to the presence of smaller particles ranges, which further suggests the possibility of smaller sizes particles to play an important role in cell wall damage and increasing the cell membrane permeability. Similar observation on maximum total protein leakage from E. coli than S. aureus upon treatment with AgNPs was reported earlier [13]. The probable reason for minimum total protein leakage from S. aureus was linked with the protective layer of high amount of peptidoglycan. The small sized particles affect a large surface area of the bacteria and therefore are more effective as antibacterial than large sized particles [18]. Increased permeability of the bacterial cell membrane or leakage of cell contents could be caused by production of reactive oxygen species (ROS) [35–37]. It was also postulated that the formation of pits in the cell wall and accumulation of AgNPs in the bacterial membrane due to its negative charge, may be responsible for the increased in the permeability of the membrane.
Table 5. Total protein leakage from the four test bacterial strains treated without and with silver nanoparticles.
| Organisms | Total protein leakage from bacterial cells (mg ml−1) | |||
|---|---|---|---|---|
| Control (untreated) | AgNP size 7.22 nm ± 3.07 nm | AgNP size 17.06 nm ± 5.78 nm | AgNP size 62.12 nm ± 31.5 nm | |
| E. coli | 0.405 ± .008a | 0.491 ± 0.004b | 0.478 ± 0.009c | 0.454 ± .006d |
| K. pneumoniae | 0.288 ± .007a | 0.385 ± 0.011b | 0.378 ± 0.005c | 0.310 ± .011d |
| B. subtilis | 0.436 ± .004a | 0.476 ± 0.004b | 0.476 ± 0.004c | 0.461 ± .005d |
| S. aureus | 0.386 ± .004a | 0.443 ± 0.005b | 0.415 ± 0.003c | 0.404 ± .005d |
Note: Mean value of three replicates with SD is presented with different letters in the same column show a significant difference at α = 0.05 levels based on Duncan's multiple range tests; AgNP concentration is 50 µg ml−1. The different letters signifies that the value (total protein leakage) of different rows of the same column are significantly different from each other. Treatment of different bacterial cells with different sizes AgNps, the total protein leakage varies. That variation is significant.
3.8. Synergistic effect of silver nanoparticles with antibiotics
Four bacterial strains (E. coli, S. aureus, B. subtilis and K. pneumoniae) were tested for synergistic effect of antibiotics with extracellularly synthesized AgNPs for bactericidal activity on Muller-Hinton agar plates. Each paper disk (~5 mm diameter) was impregnated with different antibiotics (ampicillin, chloramphenicol, streptomycin and tetracycline) having concentration 15 µg ml−1, which was further impregnated with the biosynthesized AgNPs (15 µg ml−1) having an average size of about 7.22 nm ± 3.07 nm, which were placed on an Muller-Hinton agar plate having uniform bacterial cells population of about 104 to 105 CFU ml−1. The agar plates were then incubated at 37 °C for 24 h and its zone of inhibition was measured. The antibacterial activity of ampicillin, chloramphenicol, streptomycin and tetracycline increased in the presence of AgNPs against four test strains as shown in table 6. The highest percentage of increase in antibacterial activity of AgNPs with the antibiotics was found in ampicillin followed by tetracycline, chloramphenicol and streptomycin against the tested four bacterial strains. The possible reason for increase in synergistic effect may be caused by the bonding reaction between antibiotic due to the presence of many active groups with AgNPs. The reason could be that since ampicillin mode of action is cell wall lysis, it might increases the cell permeability for AgNPs inside the cell, preventing DNA replication. Similar observation was reported earlier on maximum synergetic effect of ampicillin with AgNPs against gram positive and gram negative bacteria [38]. The probable mechanism for its synergetic effect was due to the combined effect of ampicillin and the formation of AgNP-ampicillin complex, which can react with DNA and prevent its unwinding, was reasoned. The AgNP-ampicillin complex formation occurs due to the bonding between AgNPs with the active groups present in the antibiotic. Ampicillin increases cell permeability due to cell wall lysis, allowing penetrations of AgNP-ampicillin complex inside the cell which prevents DNA replication.
Table 6. Mean zone of inhibition (mm) of different antibiotics with and without AgNPs against the four test bacterial strains.
| Bacterial strain | Antibiotics | Zone of inhibition (mm) | ||||
|---|---|---|---|---|---|---|
| Control (DW) | A | AgNP | B | C (%) | ||
| K. pneumoniae | Ampicillin | — | 9 | 14 | 17 | 88.88 |
| Chloramphenicol | — | 9 | 13 | 15 | 66.66 | |
| Streptomycin | — | 10 | 13 | 14 | 40.00 | |
| Tetracyclin | — | 11 | 13 | 19 | 72.72 | |
| E. coli | Ampicillin | — | 8 | 13 | 15 | 87.5 |
| Chloramphenicol | — | 9 | 12 | 14 | 55.55 | |
| Streptomycin | — | 11 | 13 | 15 | 36.36 | |
| Tetracyclin | — | 10 | 13 | 16 | 60.00 | |
| B. subtilis | Ampicillin | — | 10 | 12 | 18 | 80.00 |
| Chloramphenicol | — | 11 | 12 | 18 | 63.63 | |
| Streptomycin | — | 10 | 11 | 16 | 60.00 | |
| Tetracyclin | — | 11 | 12 | 19 | 72.72 | |
| S. aureus | Ampicillin | — | 7 | 9 | 13 | 85.71 |
| Chloramphenicol | — | 8 | 9 | 14 | 75.00 | |
| Streptomycin | — | 9 | 9 | 15 | 66.66 | |
| Tetracyclin | — | 10 | 10 | 17 | 70.00 | |
Note: A is antibiotics with concentration 15 µg ml−1, B is mixture of antibiotics (15 µg ml−1) and AgNP (15 µg ml−1), particle size of AgNP is 7.22 nm, C(%) is increase which is calculated as: 
3.9. Morphological changes in bacterial cells treated with silver nanoparticles
To study the effect of AgNPs on the morphology of the four test bacterial strain, AgNPs having an average size of 7.22 nm ± 3.07 nm was used. The four bacterial strains were treated with AgNPs (50 µg ml−1) for 6 h. The morphological changes in the bacterial cells treated with AgNPs were observed by SEM as shown in the figure 12. The non-treated cells of K. pneumonia, E. coli, B. subtilis and S. aureus with AgNPs have intact cell surface without any damage, whereas the bacterial cells treated with AgNPs resulted in the shrinkage of the cell and abnormalities in the cell surface morphology. These changes were found to be more prominent in B. subtilis and E. coli than in K. pneumoniae and S. aureus when examined by SEM.

Figure 12. SEM images of non-treated and treated cells with AgNPs of ((a) and (b)) K. pneumonia, ((c) and (d)) E. coli, ((e) and (f)) B. subtilis and ((g) and (h)) S. aureus, respectively.
Download figure:
Standard image High-resolution image
The shrinkage of the bacterial cell wall may be due to the leakage of the cytoplasmic content or lyses of the cell wall which may occur due to the accumulation of AgNPs in the bacterial membrane, which may increase the permeability of the bacterial cell membrane resulting in the leakage of cell contents due to formation of reactive oxygen species [35–37].
4. Conclusion
The fungal culture filtrate of A. oryzae (MTCC No. 1846) was used to study the effect on the rate of synthesis and morphology of the synthesized silver nanoparticles under various physiochemical conditions like concentration of AgNO3, pH and temperature. Increased rate in the synthesis with decrease in particles size was observed, when the concentration of AgNO3 was increased from 1–8 mM, which was reflected in the absorbance peak of the surface plasmon peak of the nanoparticle, however beyond 8 mM, larger particles were obtained. The formation of large particle at high metal ion concentration was due to aggregation. When the pH of the fungal culture filtrate was increased from 4 to 10, it resulted in rapid synthesis of AgNPs on addition of 1 mM AgNO3, with decreased in particles size, indicating the importance of alkaline condition for the reduction process. No synthesis was observed at pH range of 4–5, however at pH 10 the reaction occurred rapidly within 30 min. When the temperature of the reaction mixture, containing the fungal culture filtrate along with 1 mM AgNO3, was increased from 10 °C to 90 °C, rate of synthesis increased with decreased in particles size, however, there was no synthesis at 10 °C. Size dependent antibacterial activity of AgNPs (20 µg ml−1) having an average size viz.,7.22 nm ± 3.07 nm, 17.06 nm ± 5.78 nm and 62.12 nm ± 31.5 nm were demonstrated against four test organisms viz., E. coli, S. aureus, B. subtilis and K. pneumoniae. Maximum antibacterial activity of the silver nanoparticles was observed in K. pneumoniae followed by E. coli, B. subtilis and S. aureus. Maximum antibacterial activity was demonstrated by nanoparticle having smaller average size against all the tested bacterial strains due to its large surface area, which can interact with the functional groups. Maximum total protein leakage from the bacterial cells treated with nanoparticles with smaller size was also observed. The antibacterial activity of ampicillin, chloramphenicol, streptomycin and tetracycline increased in the presence of AgNPs against the four test strains. The highest percentage of fold increase was found for ampicillin followed by tetracycline, chloramphenicol and streptomycin. The morphological change in the bacterial cells treated with silver nanoparticles was observed when examined under SEM, with deposition of silver nanoparticles on its surfaces.
Acknowledgment
The authors are grateful to (SAIF) North Eastern Hill University, Shillong, India for TEM facility, Department of Chemistry, North Eastern Hill University, Shillong, India for FTIR analysis and Institute of Advanced Study in Science and Technology (IASST), Guwahati, India for XRD analysis. The authors would also like to thank the Department of Biotechnology, Gauhati University, Guwahati, Assam, India for their help and support to carry out the research work.