

Abstract
By dip-coating technique the thin films of nano-photocatalysts TiO2, Cr-doped TiO2, LaBO3 perovskites (B = Fe, Mn, and Co) prepared by sol-gel method, and UiO66-NH2 prepared by a solvothermal were obtained and employed for gas phase degradation of p-xylene. Physicochemical characteristics of the catalysts were examined by the methods of BET, SEM, TEM, XRD, FT-IR, TGA, Raman and UV–vis spectroscopies. The thickness of film was determined by a Veeco-American Dektek 6M instrument. The activity of catalysts was evaluated in deep photooxidation of p-xylene in a microflow reactor at room temperature with the radiation sources of a UV (λ = 365 nm) and LED lamps (λ = 400–510 nm). The obtained results showed that TiO2 and TiO2 doped Cr thin films was featured by an anatase phase with nanoparticles of 10–100 nm. Doping TiO2 with 0.1%mol Cr2O3 led to reduce band gap energy from 3.01 down to 1.99 eV and extend the spectrum of photon absorption to the visible region (λ = 622 nm). LaBO3 perovkite thin films were also featured by a crystal phase with average particle nanosize of 8–40 nm, a BET surface area of 17.6–32.7 m2 g−1 and band gap energy of 1.87–2.20 eV. UiO66-NH2 was obtained in the ball shape of 100–200 nm, a BET surface area of 576 m2 g−1 and a band gap energy of 2.83 eV. The low band gap energy nano-photocatalysts based on Cr-doped TiO2 and LaBO3 perovskites exhibited highly stable and active for photo-degradation of p-xylene in the gas phase under radiation of UV–vis light. Perovskite LaFeO3 and Cr–TiO2 thin films were the best photocatalysts with a decomposition yield being reached up to 1.70 gp-xylene/gcat.
Export citation and abstract BibTeX RIS

Original content from this work may be used under the terms of the Creative Commons Attribution 3.0 licence. Any further distribution of this work must maintain attribution to the author(s) and the title of the work, journal citation and DOI.
1. Introduction
TiO2-UV is considered as one of the most efficient photocatalytic systems for waste treatment. Despite the many known advantages, due to the large band gap energy (~3.2 eV) the use of TiO2 in solar energy utilization is limited. The results [1] indicated, that some doped metal ions can extend the working zone of TiO2 towards the region of visible irradiation. For example, addition of Cr leads to red shift of the photon absorbing zone, reducing the band gap energy of TiO2 [2] and resulting in the increase of the photocatalytic activity of Cr-doped TiO2 under solar light [3].
Perovskite has demonstrated excellent photo-catalytic activity under visible irradiation; however, most of the research has focused on treatment of pollutants in aqueous phase, the research for reaction in the gas phase is lacking the literature. Some perovskite materials have been used as photocatalysts for treatment of pollutants in waste water under visible light irradiation [4]. The perovskite-like oxides LaBO3 (B = Cu, Fe, Co, Ni, and Mn) were examined in wet peroxide oxidation of phenol as a model organic substance. The perovskite LaNiO3 with band-gap of 2.26 eV was studied for methyl orange degradation using light of wavelengths greater than 400 nm [5]. Showing strong absorption at 466 nm (Eg = 2.1 eV) LaFeO3 exhibited well and stable photocatalytic activity for decomposition of methyl orange and rhodamine B in aqueous solution under visible-light illumination [6]. Doping of Mn in LaFeO3 shows higher photo-catalytic activity [7].
In recent years metal organic frameworks (MOFs) have been known as semiconductors due to its optical transition, electrochemical and photochemical activity [8, 9]. MOFs showed high photocatalytic activity and superiority of MOFs materials are the band gap energy is easily changed by adding substances such as transition metals or organic functional groups like halogen, amine, or alkyl groups, resulting in increased photocatalytic activity of MOFs and the use of solar light becomes more efficient [10, 11]. MOF-5 shows photocatalytic activity in the decomposition of phenol [12]. UiO, the water resistance MOF, is used as photocatalyst for the oxidation of water and reduction of CO2 under irradiation of the light with wavelengths greater than 300 nm [13]. Gascon et al [14] used isoreticular MOFs as photocatalysts for propene oxidation in the gas phase.
In this article in order to create semiconductor with narrower band gap for harvesting the sun light two approaches are proposed: (i) to introduce chromium additive to the structure of TiO2 in order to make it to be active photocatalysts in a wider zone of solar irradiation, including visible light; (ii) preparation of visible-light active photocatalysts on the basis of perovskite and MOF materials.
2. Experimental
2.1. Catalyst synthesis
Pure TiO2 catalyst was prepared by the sol–gel method as follows: 15 ml of tetraisopropyl orthotitanate Ti(OC3H7)4 (TTIP, Sigma, >99%) was added to an ethanol-HNO3 mixture (Merck, >99%) with a pH of about 3–4 and stirred for 10 min to obtain a transparent solution. The solution was added drop wise to 10 ml of deionized water, stirred at room temperature for 2 h to form a highly viscous solution. The solution was standing for 24 h to obtain a transparent soft gel.
TiO2 catalyst doped 0.1 mol% Cr2O3 was prepared by the sol-gel method according to above procedure, with a difference 10 ml of deionized water added drop wise was replaced by 10 ml Cr(NO3)3 (Xilong, >99%) solution in deionic water. The powder Cr-doped TiO2 was obtained and denoted as Cr–TiO2.
LaBO3 perovkite catalysts (B = Fe, Mn, and Co) were prepared by the sol-gel method, according to the optimal procedure, which we have identified, as follows. Three precursors La(NO3)3·6H2O, B(NO3)x·nH2O (Sigma, >99%) and acid citric (Merck, >99%) at the mole ratio 1:1:1.38 were dissolved in a volume of 125 ml of deionized water and stirred at 60 °C for 10 min to obtain a transparent solution. The solution was added drop wise to 5 wt% NH4OH (Xilong, 25%) solution until the pH solution reached 7.0 and continuously stirred for 2 h to obtained a sol solution. Then, this solution was standing in the atmosphere for 24 h.
Amoni-functionalized UiO66 (UiO66-NH2) was synthesized by a solve-thermal method, described in detail in our previous article [15], with a difference CH3OH was used as an exchanged solvent instead of CH2Cl2.
The catalysts was developed into a thin film on the surface of pyrex tube (length of 270 mm, outer diameter of 19 mm) by a process of dip-coating with the gel solution. The glass tube was previously well treated with its surface by soaking it in the solutions of 1% HF and KOH/MeOH 1% in 24 and 18 h, respectively, followed by a heat treatment at the temperature of 450 °C in 1 h. The dip-coating was carried out repeatedly to obtain 15 mg of catalyst on the glass tube of 225–230 mm in length, 19 mm in outer diameter and thin film surface area of 130 cm2. Afterward, the thin film of material was dried in the air and then in the dryer at 80, 100, and 120 °C in 2 h per each temperature. The catalyst was activated at the optimal temperatures and time based on the results of our previous works such as TiO2 and Cr–TiO2: 450 °C for 2 h; LaFeO3: 500 °C for 3 h; LaMnO3: 500 °C for 2 h; LaCoO3: 600 °C for 3 h; and UiO66-NH2: 200 °C for 7 h under vacuum.
2.2. Physico-chemical characteristics analyses
Physico-chemical characteristics of catalysts were investigated by various methods, including BET surface areas and pore volumes (N2 physisorption), x-ray powder diffraction analysis (XRD), thermogravimetric analysis (TGA), Raman spectroscopy, scanning electron microscopy (SEM), transmission electron microscopy (TEM), Fourier transform infrared (FTIR), and UV–vis absorption spectroscopy. The thickness of catalyst thin film was measured by a Veeco-American Dektek 6M instrument.
2.3. Photocatalytic activity
The photocatalytic activity of the thin film catalysts in the degradation of p-xylene was studied by conducting photoreactions in a micro flow reaction system, wherein the loaded amount of catalyst film was 15 mg, the specific total airflow rate was 3 l h−1 and radiation sources included 01 UV lamp (λ = 365 nm, light intensity 430 lux, power 8 W) and 81 LED lamps (λ = 400–510 nm, total intensity 32 lux, total power 19.2 W) with the total light intensity 659 Lux. The content of p-xylene, moisture and oxygen were kept constant at 19 mg l−1, 15.2 mg l−1 and 300 mg l−1. Reactor made of quartz was U shape (inner diameter of 20 mm). The optimal catalyst based on the by-time p-xylene conversion and 60 min reaction efficiency was determined.
The gas reaction mixture was analyzed on an Agilent Technologies 6890 Plus chromatography with FID detector and capillary column DB-624 (30 m in length, 250 µm in diameter and 0.32 µm in film thickness).
3. Results and discussion
3.1. Physicochemical characteristics of materials
The XRD spectra of catalysts showed that TiO2 only existed in anatase phase. On XRD spectra of both TiO2 based catalysts (figure 1(a)), characteristic peaks of TiO2 anatase phase appeared at 2θ = 25.3°, 37.8°; 48.1°; 55.1° and 62.7° with the strongest intensity at 2θ = 25.3°. The intensity of the anatase peaks in Cr-doped TiO2 is higher than in pure TiO2 sample that indicated the crystallite of doped catalyst is better.
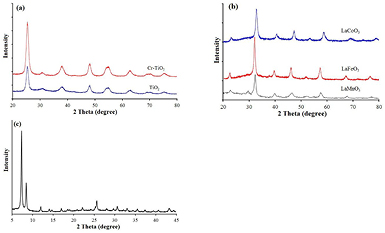
Figure 1. XRD patterns of photocatalysts: (a) TiO2-based catalysts; (b) LaBO3 perovskite (B = Fe, Mn, and Co) and (c) UiO66-NH2.
Download figure:
Standard image High-resolution imageXRD pattern in figure 1(b) presented feature peaks of perovskites LaCoO3, LaFeO3 and LaMnO3. The data indicated that all perovskites have high crystallinity. In comparison with LaCoO3 and LaMnO3, LaFeO3 catalyst showed higher intensity of characteristic peaks. XRD pattern in figure 1(c) revealed that UiO66-NH2 was successfully synthesized with two characteristic peaks of original UiO66 at 2θ = 7.31° and 8.52°. The catalyst was proved to have high single crystallinity due to the narrow and high-intensity peak.
The FTIR spectra (figure 2(a)) of TiO2-based catalysts showed the characteristic peaks of basic OH-groups on TiO2 surface at ν ~ 3350 cm−1 and adsorbed water molecules (ν = 1630 cm−1). The peaks at 400–700 cm−1 may be attributed to the vibration of Ti–O–Ti and Ti–O or Cr–O. On the FTIR spectra of perovskites also appeared OH-groups and adsorbed water molecules (figure 2(b)). Besides, the bands correspond to the physically surface-absorbed CO2 at about 2300–2400 cm−1, the band B–O (B = Mn, Co and Fe) stretching vibration, O–B–O and bending vibration BO6 octahedron in perovskites about 550–600 cm−1 [16] were observed. Compared to the TiO2 catalysts, the perovskites showed higher intensity of the peak corresponding to OH-groups but lower free-linker water molecules.
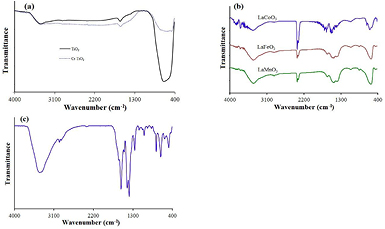
Figure 2. FTIR spectra of photocatalysts: (a) TiO2-based catalysts; (b) LaBO3 perovskites (B = Fe, Mn, and Co); and (c) UiO66-NH2.
Download figure:
Standard image High-resolution imageOn UiO66-NH2 catalyst, the bands in the range of 1400–1600 cm−1 were observed (figure 2(c)), indicating the occurrence of the reaction of Zr4+ center with carboxylic groups of the linkers to form carboxylate compound. The peaks at 1835, 1570 and 1430 cm−1 can be assigned to the stretching of COO2−. Additionally, the band of 3420 cm−1 was a feature of the amino group on the organic linker. This result looked similar to the frequency reported by author [17].
As it follows from the thermogravimetric analysis (TGA) (figure 3(a)) the TiO2-based catalysts were decomposed in three steps. Firstly, the decomposition was attributed to the removal of water from the surface (mass loss of about 5.36%) from 50 to 190 °C. The second decomposition was formed from 190 to 400 °C with 1.3% mass reduction observed in this region. This is because of the dehydration and/or removal of organic residues [18]. Finally, the decomposition from 400 to 600 °C resulted in an additional mass loss of about 0.25%. Above 600 °C, an unchanged mass (93.3% mass) has been found indicating the thermal stability of the sample. Compared to the pure TiO2, the mass loss of Cr–TiO2 catalyst was lower (96.7% remaining mass) proving that the catalyst had higher thermal stability.
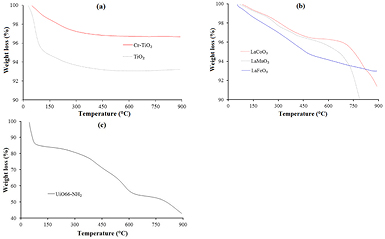
Figure 3. Thermogravimetric analysis (TGA) of photocatalysts: (a) TiO2-based catalysts; (b) LaBO3 perovskites and (c) UiO66-NH2.
Download figure:
Standard image High-resolution imageTGA curves of perovskites sample (figure 3(b)) showed three various states of decomposition. The first decomposition in temperature range of 50–190 °C was attributed the loss of moisture from the perovskites. The final mass loss was occurred from 420 to 780 °C indicating organic combustion steps [19]. The results indicated that the perovskites also had high thermal stability with remaining mass of 89.9, 91.4, and 93%, respectively for LaMnO3, LaCoO3 and LaFeO3 catalysts.
From the results in figure 3(c), it follows that there were three main observed mass loss steps. The first weight loss of around 16% occurred between the temperature of 30 °C and 130 °C due to the vaporization of water and/or organic solvent. Afterward, from 130 °C to 400 °C there was another 15% mass loss resulted from the dehydroxylation of –OH− groups at the temperature of 250–300 °C [20]. And finally, the third main step of weight loss was about 27% beyond 400 °C due to the decomposition of catalyst sample. As a result, the thermal stability of UiO66-NH2 in this work was around 400 °C that was agreed with the result of other reports [15, 17, 21].
Raman spectra of TiO2 and Cr–TiO2 catalysts (figure 4(a)) also only reveal the characteristic peaks of anatase phase at ~144, 197, 399, 513 and 639 cm−1 [22]. The peaks at 144 and 639 cm−1 are mainly caused by the symmetric stretching vibration of O–Ti–O while the one at 399 cm−1 is created by the symmetric bending vibration of O–Ti–O; finally, the one at 513 cm−1 is formed by anti-symmetric bending vibration of O–Ti–O [23]. Besides, no characteristic peaks of chromium oxides were observed.
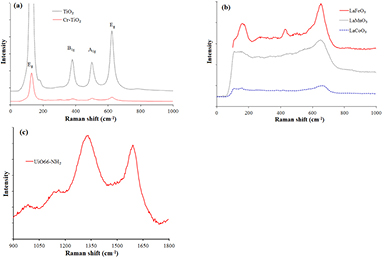
Figure 4. Raman spectra of photocatalysts: (a) TiO2-based catalysts; (b) LaBO3 perovskites and (c) UiO66-NH2.
Download figure:
Standard image High-resolution imageAs seen from figure 4(b), the Raman spectrum of LaFeO3 perovskite shows the characteristic peaks of LaFeO3 at 155, 175, 429 and 648 cm−1. Two peaks at 155 cm−1 and 175 cm−1 are related to La in the sample, and the peaks at 429 cm−1 and 648 cm−1 represent for the bending vibration of oxygen octahedral and oxygen stretching vibration, respectively [24, 25]. The Raman spectrum of LaCoO3 sample has also four characteristic vibrations of LaCoO3 perovskite at 112, 158, 263 and 668 cm−1. Two features at 112 cm−1 and 158 cm−1 can be ascribed to the rotational mode around the a and b axes of oxygen atoms and La atoms respectively, the one at 263 cm−1 can be assigned to the rotational mode of oxygen atoms around the c axis, and the other peak at 668 cm−1 is formed by the vibration of Co–O species [26]. Four features related to LaMnO3 perovskite at 109 cm−1 (the vibrational mode of La atoms), 179 cm−1 (La vibration in the hexagonal (0 0 1)h plane), 520 cm−1 (oxygen bending vibration), and 640 cm−1 (stretching oxygen vibration) [27, 28] have been observed in the Raman spectrum of LaMnO3 sample in figure 4(b). The characteristic peaks of both lanthanum oxides and iron/cobalt/manganese oxides did not appear on the Raman spectra of all perovskites that is consistent with the results of the XRD analysis.
Raman spectra of UiO66-NH2 (figure 4(c)) shows the two main peaks of the bands ν(C =C)/ν(C=N)/ν(C=O) or ν(C-ring) at 1587 cm−1 and ν(C–N–N=C) at 1315 cm−1. Additionally, two weakly vibrations at 1127 cm−1 and 956 cm−1, attributed to the bands of ν(C, N-rings) and ν(CNC), respectively [29], were also observed.
SEM and TEM images (figures 5(a), (b) and 6(a), (b)) of the TiO2 catalysts showed that the nanometer particles structure has been formed. The particle of Cr–TiO2 catalyst was more uniform and smaller than pure TiO2. Particle size of TiO2 and Cr–TiO2 was about 25–100 nm and 10–40 nm, respectively, in the result the specific surface area of the second catalyst is higher than that of the first one (98.7 m2 g−1 compared to 25.9). On perovskites, all samples appeared in small nanoparticle (7.6–12.1 nm) as shown in figures 5(c)–(e) and 6(c)–(e). Meanwhile, the particle size on the sample LaCoO3 (7.6 nm) was smaller than those on other samples. In comparison with pure TiO2, the perovskites prepared by sol-gel method had smaller particle size, although they had smaller BET surface area (table 1). For UiO66-NH2 catalyst, the crystals were formed in a ball shape and particle size was 100–200 nm (figure 5(f)). Despite relatively large particle size, it reached the highest BET surface (576 m2 g−1) thanks to its high porosity.
Table 1. Average crystal size based on a feature XRD peak
| Catalyst | dcrys (nm) | dp (nm) | SBET (m2 g−1) | Vpor (cm3 g) | dpor (Å) | Eg (eV) | Λ (nm) | δ (µm) |
|---|---|---|---|---|---|---|---|---|
| TiO2 | 25.2 | 25–100 | 25.9 | 0.042 | 11.1 | 3.03 | 410 | 4.8 |
| Cr–TiO2 | 9.0 | 10–40 | 98.7 | 0.034 | 9.0 | 1.99 | 622 | 2.9 |
| LaFeO3 | 9.3 | 8–15 | 32.7 | 0.127 | 52.4 | 1.92 | 646 | 4.8 |
| LaMnO3 | 12.1 | 15–35 | 24.8 | 0.075 | 28.4 | 2.20 | 561 | 5.1 |
| LaCoO3 | 7.6 | 10–40 | 17.6 | 0.065 | 84.4 | 1.87 | 663 | — |
| UiO66-NH2 | 35.0 | 100–200 | 576.0 | 0.379 | 19.0 | 2.83 | 438 | 4.2 |
aTiO2 catalysts: 2θ = 25.3°; LaFeO3: 2θ = 32.2°; LaMnO3: 2θ = 32.4°; LaCoO3: 2θ = 32.9°. UiO66-NH2: 2θ = 7.31°.

Figure 5. SEM images of the photocatalysts: (a) TiO2; (b) Cr–TiO2; (c) LaFeO3; (d) LaMnO3; (e) LaCoO3 and (f) UiO66-NH2.
Download figure:
Standard image High-resolution image
Figure 6. TEM images of the photocatalysts: (a) TiO2; (b) Cr–TiO2; (c) LaFeO3; (d) LaMnO3; (e) LaCoO3.
Download figure:
Standard image High-resolution imageBand gap energy of semiconductor in general is calculated by popular method based on Tauc plot [30]. The relationship between  and (
and ( ) is built to determine band gap energy Eg, where
  is reflectance from Kubelka–Munk transformation. It is determined by following equation
where R is the reflectance with R = 1 − A with A is absorbance.
The Tauc plot of catalysts is showed in figure 5, where Eg is determined at the point of intersection of the tangent line and the horizontal axis. Then, light wavelength threshold was calculated by the follow equation
where h is Planck constant (eV), c is light speed (nm s−1), λ is light wavelength (nm) and ν is light frequency (s−1).
The results of band gap energy calculated from figure 5 are indicated in table 1.
UV–Vis diffuse reflectance spectra of TiO2 catalysts (figure 7(a)) indicated that doping Cr into TiO2 enables to extend the region of the photon absorption zone of TiO2 towards the visible waves (from λ = 410 nm to 622 nm) as well as to reduce its band gap energy from 3.03 eV down to 1.99 eV. Meanwhile, Tauc plot of perovskites (figure 7(e)) indicated the band gap energy (Eg) of about 1.87–2.2 eV, leading to extend the region of the higher photon absorption zone in the visible light. The authors [31, 32] also obtained the same results, and indicated that LaBO3 had low band gap energy as well as visible waves region of the photon absorption.
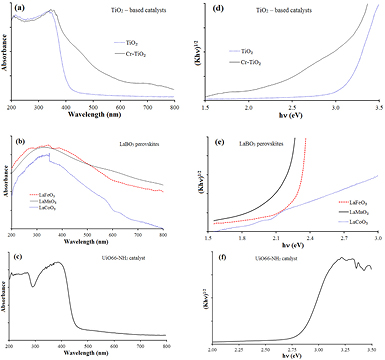
Figure 7. UV–vis spectra (a)–(c) and Tauc plot (d)–(f) of photocatalysts.
Download figure:
Standard image High-resolution imageThe UV–vis spectrum of the UiO66-NH2 (figure 7(c)) indicated an absorption band-edge at around 440 nm, while pristine UiO66 was transparent 350–800 nm [33]. The red shift of absorption edge was ascribed to the introduction of the amino group to the structure of UiO66. The result was in an agreement with that of other paper [33]. Based on the Tauc plot (figure 7(f)), the band gap energy of 2.83 eV was determined, which is close to that of Long et al [33].
Results of UV–vis analysis showed that Cr-doped TiO2 and perovskites LaBO3 were able to absorb light at wavelengths greater than 560 nm, whereas pure TiO2 and UiO6-NH2 absorbed light of shorter wavelength (lower 460 nm), so ability using visible light of the Cr–TiO2 and LaBO3 is better.
3.2. Photocatalytic activity of catalyst thin films
The experimental indicated that p-xylene was completely converted into solely CO2 and H2O molecules. Based on photolysis results, the UV + LED light was evidenced not to be able to decompose p-xylene. Besides, the adsorption analysis revealed that p-xylene was trivially adsorbed on the catalyst surface and the adsorption and desorption were carried out continuously during the reaction. The photocatalytic activity of the studied nanocatalysts in p-xylene photodegredation was shown in figure 8 and table 2.
Table 2. Activity of the catalysts in the total photooxidation of p-xylene: the 5 min conversion (X5), stable conversion (X) and the 60 min efficiency (H).
| Catalysts | X5 (%) | X (%) | H (gp-xylene/gcat) |
|---|---|---|---|
| TiO2 | 80.5 | 14.1 | 1.53 |
| Cr–TiO2 | 70.9 | 45.5 | 1.69 |
| LaFeO3 | 100 | 35.8 | 1.70 |
| LaMnO3 | 87.8 | 37.6 | 1.57 |
| LaCoO3 | 72.9 | 26.1 | 1.29 |
| UiO66-NH2 | 88.0 | 20.9 | 1.27 |

Figure 8. By-time p-xylene conversion over thin film photocatalysts. (V = 3 l h−1, mcat = 15 mg, Cp-xylene = 19 mg l−1; Cmoisture = 15.18 mg l−1; Coxygen = 300 mg l−1).
Download figure:
Standard image High-resolution image
As it follows from table 2, all catalysts expressed very high initial activity (initial conversion is over 70%) despite the low loaded amount of catalyst (15 mg) was used, suggesting that they are highly active photocatalysts under combine radiation of UV–vis lights. However, the catalytic activity reduced with reaction time. According to the rules of activity reduction over time, the catalysts can be divided into two groups. The first group consists of two catalysts TiO2 and UiO66-NH2 characterized by a continuous reduction of the conversion in the 60 min (shown in figure 6), in which pure TiO2 catalysts have a higher activity reduction rate compared to that of UiO66-NH2. The second group consists of the remaining four catalysts. The general rule of this catalyst group is rapid reduction of p-xylene conversion in the first 15–20 min, after which the conversion is maintained steadily over reaction time. This may be related to the fact that TiO2 and UiO66-NH2 catalysts absorb the near-visible light of the high-intensity UV lamp, which facilitates the carbon deposit on the catalyst surfaces that should lead to reduce in activity. Meanwhile, the four catalysts of second group absorbed the visible light of low-light LEDs, resulting in lower carbon deposit and catalysts work stability, as already found in article [34]. Perovskites LaFeO3 and Cr–TiO2 thin film were the best photo-catalysts under combined UV + LED illumination with a yield reached up to 1.70 gp-xylene/gcat.
4. Conclusion
By the simple dip-coating method, thin films of nano-photocatalysts with low band gap energy based on TiO2, Cr-doped TiO2, LaBO3 perovskites (B = Fe, Mn, and Co), and UiO66-NH2 with an average thickness of 2.9–5.1 µm were obtained. The thin films on the basis of Cr-doped TiO2 and LaBO3 perovskites ranging between 8 and 40 nm were able to absorb light at wavelengths greater than 560 nm and exhibited highly stable activity for the gas phase photodegradation of p-xylene under radiation of combined UV + Vis lights. Among catalysts, perovskite LaFeO3 and Cr–TiO2 thin films have band gap energy as low as 1.99 eV and are the best catalysts with a decomposition yield of 1.70 gp-xylene/gcat.
Acknowledgment
This research is funded by Vietnam National Foundation for Science and Technology Development (NAFOSTED) under grant number 104.05-2016.01.