

Abstract
It is well known that cyanide is an extremely toxic lethal poison with human death within minutes after exposure to only 300 ppm cyanide. On the other hand, cyanide is released into the environment (mainly through waste water) every day from various human activities. Therefore, rapid, sensitive and cost-effective cyanide trace detection is an urgent need. Surface-enhanced Raman scattering (SERS) is a method that meets these requirements. It should be noted, however, that in this technique SERS substrates, which are usually made of gold or silver, will be leached with aqueous cyanide by the formation of complexes between gold or silver with cyanide. This will cause the SERS spectrum of cyanide to be modified. When determining cyanide concentrations by SERS analysis, this spectral modification should be taken into account. This report presents the SERS spectral modification of aqueous cyanide traces (in ppm and lower concentration range) when the SERS substrates used are flower-like silver micro-structures.
Export citation and abstract BibTeX RIS

Original content from this work may be used under the terms of the Creative Commons Attribution 3.0 licence. Any further distribution of this work must maintain attribution to the author(s) and the title of the work, journal citation and DOI.
1. Introduction
Cyanide is any chemical compound that contains at least one cyano group, in which one carbon atom triple-bonded to one nitrogen atom  . In addition, it can also be said that cyanide is the anion
  . Inorganic cyanides are the salts of hydrocyanic acid (HCN), in which the hydrogen is replaced with a metal, such as sodium, or potassium. Note that HCN is also known as hydrogen cyanide. In practice, hydrogen cyanide (HCN), sodium cyanide (NaCN), and potassium cyanide (KCN) are the most toxic cyanides and on the other hand, they appear to be the most commonly present in the environment [1]. With a boiling point of 26 °C, hydrogen cyanide is a colorless gas or a volatile liquid. It has a bitter almond-like odor that many people can smell. NaCN and KCN are both white powders. They also often smell like almonds in damp air due to the presence of HCN which is formed during hydrolysis. NaCN and KCN are the most frequently used cyanides. It is well known that cyanide is a lethal toxin [2–5]. Human death will occur within minutes after exposure to 300 ppm cyanide, while lower-cyanide exposure for long periods of time will cause damage to the central nervous system [2–5]. For this reason, the US Environmental Protection Agency (EPA) has set the maximum threshold of cyanide in the drinking water at 200 ppb [2–5]. However, the acceptable level of cyanide in water or in soil for humans is of course much lower than this calibration. In general, cyanide is present in many industrial and municipal wastewaters. The most important source of cyanide pollution is from effluents of electroplating processes, metallurgy, steel processing, gold ore mining and petroleum industries. The above suggests that it is an urgent need to control cyanide concentrations in water and in soil. This is especially true for Vietnam after the incident of mass death of fish and other aquatic species in the coastal areas in central Vietnam in April 2016. The subsequent study of specialized scientists invited by the Government of Vietnam has shown that the waste water from Formosa steel plant in Ha Tinh province (owned by Taiwan Formosa Plastics Group), which contain toxic chemicals such as cyanide, phenol and iron hydroxides, was the cause of this mass death.
Among the cyanide identification and quantification methods, Raman scattering emerged as a technique with many advantages. In Raman scattering, each type of molecule gives a distinct Raman spectrum as its characteristic fingerprint. Furthermore, intensity of the major bands in the Raman spectrum of a molecule is proportional to its concentration in the sample being analyzed. In particular, the detection of cyanide through the Raman spectrum is particularly advantageous due to the C≡N triple bond. With this triple bond, cyanide has a distinct peak around 2100 cm−1, while most other Raman-active molecules show bands in the lower wavenumber region. However, Raman scattering has a major disadvantage as its probability is very low. It was estimated that only one photon was inelastically (i.e. Raman) scattered of  incident photons. As a result, Raman spectroscopy is a technique with very poor sensitivity, with a typical detection limit of just 0.1% (1000 ppm). Fortunately, it has been discovered that the sensitivity of Raman spectroscopy can be greatly improved through surface-enhancement [6, 7]. The interaction of surface plasmon modes of metal nanoparticles with the molecules of the analytes can increase the Raman scattering efficiency by up to 14 orders of magnitude in the best case. In normal cases, the increase in Raman scattering efficiency is about 6 orders. Surface-enhanced Raman spectroscopy (SERS) has thus become a very attractive spectroscopy for ultratrace identification with the detection limit in the ppb concentration range in many cases, and even with the potential of single molecule detection [8, 9].
In SERS, Raman scattering is enhanced dramatically when the molecules of the analyte are located close to a rugged at the nanoscale surface, or close to the surface of a system of precious metal nanoparticles (MeNPs) such as silver or gold nanoparticles. Such a nano-rugged metal surface or such a system of MeNPs is often referred to as the SERS substrate. In the SERS technique, the Raman scattering enhancement factor is largely determined by the properties of the SERS substrate. The most important properties include the size and morphology of MeNPs, the distance between MeNPs and the metallic nature of MeNPs. It has been found that the MeNP systems with nanoparticles of spiky or high curvilinear shape and located very close to each other (only a few nanometers apart) will have a high enhancement factor. Hence, a MeNP system with such characteristics is often chosen as the SERS substrate.
Regarding the SERS spectra recording of traces of cyanide in water, it has been found that using silver or gold SERS substrates will result in the creation of silver or gold complexes with cyanide [2, 10, 11]. It is well known that when silver or gold is added to the aqueous solution of an alkaline cyanide (e.g. NaCN or KCN), it reacts with the cyanide to form a soluble complex. This process is called cyanidation [12] or simply leaching, in which silver or gold dissolved through cyanide complexation. Leaching is a common process used in gold ore mining. Accordingly, it is clear that when dripping an aqueous solution of NaCN or KCN onto a SERS substrate, which is made from silver or gold, the cyanidation process will also take place. The result of cyanidation is that the complexes between cyanide and gold or silver are formed, and so instead of recording the SERS spectrum of cyanide, we will record the spectrum of cyanide along with the spectrum of these complexes. In addition, the partial dissolution of the SERS substrate with cyanide will make the SERS signals weaker. To overcome the problem of cyanidation in SERS cyanide detection, in general the authors in the literature have used the method of limiting SERS substrate immersion time in the aqueous solution of cyanide. More specifically, in [2], in order to avoid the leaching of gold atoms into ![${{\left[ {\rm Au}{{\left( {\rm CN} \right)}_{2}} \right]}^{-}}$](https://content.cld.iop.org/journals/2043-6262/9/2/025006/revision1/ansnaabef8ieqn004.gif) soluble complex when using gold nanoparticles (AuNPs) as the SERS substrate for detecting traces of cyanide, Senapati et al have restricted the time to 4 min for the whole process from adding cyanide solution to Raman spectrum recording. In [10], the silver micro/nanostructured SERS substrates were immersed into KCN solution with the concentrations up to 1 ppm for only 10 min and dried with high-purity flowing nitrogen before Raman spectral measurement. It has been demonstrated that the morphology of the substrate is almost unchanged after 10 min immersion compared with that of the original one. In contrast, in order to avoid the dissolution of gold in cyanide solutions, the authors of [11] used a silica shell to cover the gold core. Unfortunately, so far there has not been a paper on how the SERS spectrum of cyanide will change with the leaching of silver or gold SERS substrate.
soluble complex when using gold nanoparticles (AuNPs) as the SERS substrate for detecting traces of cyanide, Senapati et al have restricted the time to 4 min for the whole process from adding cyanide solution to Raman spectrum recording. In [10], the silver micro/nanostructured SERS substrates were immersed into KCN solution with the concentrations up to 1 ppm for only 10 min and dried with high-purity flowing nitrogen before Raman spectral measurement. It has been demonstrated that the morphology of the substrate is almost unchanged after 10 min immersion compared with that of the original one. In contrast, in order to avoid the dissolution of gold in cyanide solutions, the authors of [11] used a silica shell to cover the gold core. Unfortunately, so far there has not been a paper on how the SERS spectrum of cyanide will change with the leaching of silver or gold SERS substrate.
In this report we will present the results of SERS spectra recordings of cyanide with different low concentrations diluted either in ethanol or water. The SERS substrates we used to record the spectrum of cyanide were the silver micro-flowers grown on silicon, which have been fabricated in our group. We will show that, unlike the case of using ethanol for dilution, in the case of using water as a diluent, the leaching of silver substrate would take place and this would cause the SERS spectrum of cyanide to change. Furthermore, the degree of modification of the SERS spectrum depends on the concentration of cyanide in the water. We will also give an explanation of why the change in SERS spectrum is dependent on cyanide concentrations.
2. Experimental
For use as SERS substrates, arrays of silver flower-like microparticles on silicon (which are often referred to as silver micro-flowers on silicon (AgMFs@Si)) have been fabricated by reducing silver nitrate  with ascorbic acid (AA) in the presence of polyvinyl pyrrolidone (PVP) capping agent. The manufacturing process is similar to that described in [13], with only one difference, that is, the additional use of PVP. More specifically, silver micro-flowers (AgMFs) have been fabricated by the chemical deposition on the surface of silicon wafers at room temperature. Silicon used is p-type single crystal, orientation (1 1 1). Chemicals used include:
  (98%), HF (40%), PVP (Mw 55.000), absolute ethanol, acetone and deionized (DI) water. Prior to silver deposition, silicon samples were cleaned of grease by soaking in ethanol and acetone. Subsequently, these clean silicon samples were immersed in an aqueous solution of 5% HF for 5 min to remove the native silicon oxide layer. In a typical experiment of silver chemical deposition, a solution containing 4.8 M HF and 1 mM
  was stirred at a speed of 200 rpm for 5 min with the aim of creating a homogeneous solution, after that a treated silicon sample is placed in the above solution, simultaneously with the addition of a predetermined amount of prepared PVP solution. The concentration of PVP is 1, 3 or 5 mM. After the fabrication ended, AgMFs@Si sample was taken out from the beaker carefully and washed with DI water to remove residues of the reactant that remained on the sample surface. The structure and morphology of the AgMFs@Si samples were examined by scanning electron microscopy (SEM), using the SEM model S-4800 (Hitachi, Japan).
Analytical grade potassium cyanide (KCN) powder was purchased from Xilong Chemical Co., Ltd (Guangdong, China). In preparation for recording the SERS spectra of trace cyanide, this powder was first diluted in ethanol or DI water to a concentration of 1000 ppm to produce a stock solution. Next, this stock solution was diluted sequentially with either ethanol or DI water to the concentrations to be analyzed (in ppm region). In preparation for the SERS measurements, 25 µl of the KCN solution at different concentrations were dripped onto the surface of the AgMFs@Si samples with a spread area of  . Subsequently, the KCN solution-coated AgMFs@Si samples were left in air at room temperature until dry. Raman spectral recording was performed only after the sample was completely dry (about 24 hours after the cyanide solution was dripped onto the SERS substrate). The Raman spectral acquisition was carried out with the LabRAM HR 800 Raman spectrometer (HORIBA Jobin-Yvon, France), which uses a 632.8 nm laser as the source of excitation.
3. Results and discussion
The results of AgMFs@Si fabrication for use as SERS substrate are illustrated in figure 1. More specifically, figure 1 shows the silver micro-flowers of about  size, obtained in solutions of 4.8 M HF, 1 mM
  , 10 mM AA and various mM numbers of PVP (1, 3 and 5 mM). It can be seen that the petals become more prominent and sharp as the PVP levels increase. This demonstrates that by adding an appropriate amount of PVP to the chemical solution, we have obtained better silver flowers than using non-PVP solutions as in [13]. Solution with 5 mM PVP was used to produce AgMFs@Si samples for recording the SERS spectrum of trace cyanide. Note that by chemical deposition, although we would like to, but we were not able to produce silver nano-flowers.
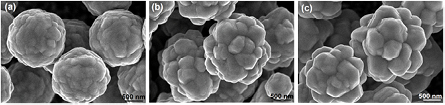
Figure 1. Variation of the morphology of AgMFs with the concentration of PVP in the chemical deposition solution: (a) 1 mM, (b) 3 mM, and (c) 5 mM. Note that in addition to PVP, the deposition solution also contains 4.8 M HF, 1 mM AgNO3 and 10 mM AA.
Download figure:
Standard image High-resolution imageThe SERS spectra in the  region of the KCN which has been dissolved in ethanol to concentrations of 5, 1, 0.5, 0.1 and 0.05 ppm and then dripped onto the AgMFs@Si SERS substrate are shown in figure 2. From this figure it can be clearly seen that KCN has a prominent single peak at
  , which can be attributed to the
  stretching. In the regular Raman spectrum of cyanide, the
  stretching mode appears as a sharp peak around
  [14]. In the SERS spectrum, this band is shifted toward higher wavenumbers due to the chemical interaction of cyanide with SERS substrate. Figure 2 demonstrates that the higher the concentration of the KCN, the stronger the intensity of the peak at
  . In addition, it is clear that we can easily identify the presence of the KCN with the concentration of 0.05 ppm (50 ppb) onwards.
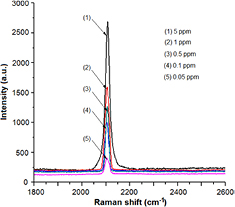
Figure 2. The SERS spectra in the  region of the KCN on the AgMFs@Si substrate, where KCN was diluted with ethanol to concentrations of 5, 1, 0.5, 0.1 and 0.05 ppm.
Download figure:
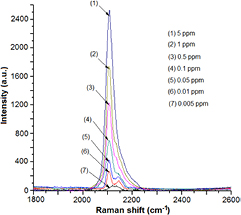
Standard image High-resolution imageThings will be different when KCN is dissolved in water. In figure 3 are the SERS spectra in the  region of KCN, which has been diluted with water to concentrations of 5, 1, 0.5, 0.1, 0.05 and 0.01 ppm. Such diluted KCN was dripped onto the AgMFs@Si substrate, and then allowed to dry naturally for about 24 hours prior to recording the Raman spectrum. It can be seen that compared to figure 2, in general the band at
  is still present, but with a change in shape. More specifically, the Raman spectra recorded at high KCN concentrations (5–0.5 ppm) have a band with a peak at
  but with the tail extending forward. When the KCN concentration decreases, first a shoulder appears, then the band is gradually split into two peaks, one peak at
  , and the other at
  . The peak at
  emerges most clearly when the cyanide concentration is 0.01 ppm. In our opinion, the modification of the band at
  in figure 3 compared to figure 2 is due to the cyanidation of silver SERS substrate, which occurred when KCN was dissolved in water (instead of ethanol). Indeed, it is well known that the chemical reaction that causes the dissolution of silver during leaching (if KCN is used) is as follows [15]:

Figure 3. The SERS spectra in the  region of the KCN on the AgMFs@Si substrate, where KCN was diluted with water to concentrations of 5, 1, 0.5, 0.1, 0.05 and 0.01 ppm.
Download figure:
Standard image High-resolution image
According to equation (1), leaching can only take place in the presence of oxygen and water. When we used ethanol to dilute KCN, there was no water at all, so silver cyanidation (leaching) did not occur. Therefore the band at  remains the
  stretching band, as shown in figure 2. But when water is used to dilute cyanide, cyanidation is likely to take place. If cyanidation is not complete, then along with the
  stretching band peaking at
  , there is a band (or bands) that are caused by the complexes between silver and cyanide. If it is true that reaction (1) occurred in practice, the silver-cyanide complex causing the band would have to be
 ![${{\left[ {\rm Ag}{{\left( {\rm CN} \right)}_{2}} \right]}^{-}}$](https://content.cld.iop.org/journals/2043-6262/9/2/025006/revision1/ansnaabef8ieqn031.gif) ion. According to information from the literature, the vibration of the
ion. According to information from the literature, the vibration of the ![${{\left[ {\rm Ag}{{\left( {\rm CN} \right)}_{2}} \right]}^{-}}$](https://content.cld.iop.org/journals/2043-6262/9/2/025006/revision1/ansnaabef8ieqn032.gif) ion causes a band at 2140 cm−1 [16]. At the same time in figure 3 we observe this band, so we can come to the conclusion that the reaction (1) took place in practice and that
ion causes a band at 2140 cm−1 [16]. At the same time in figure 3 we observe this band, so we can come to the conclusion that the reaction (1) took place in practice and that ![${{\left[ {\rm Ag}{{\left( {\rm CN} \right)}_{2}} \right]}^{-}}$](https://content.cld.iop.org/journals/2043-6262/9/2/025006/revision1/ansnaabef8ieqn033.gif) ion was formed. Note that the following silver cyanide complex ions may exist in aqueous solution:
ion was formed. Note that the following silver cyanide complex ions may exist in aqueous solution: ![${{\left[ {\rm Ag}{{\left( {\rm CN} \right)}_{2}} \right]}^{-}}$](https://content.cld.iop.org/journals/2043-6262/9/2/025006/revision1/ansnaabef8ieqn034.gif)
![${{\left[ {\rm Ag}{{\left( {\rm CN} \right)}_{3}} \right]}^{2-}}$](https://content.cld.iop.org/journals/2043-6262/9/2/025006/revision1/ansnaabef8ieqn035.gif) , and
, and ![${{\left[ {\rm Ag}{{\left( {\rm CN} \right)}_{3}} \right]}^{3-}}$](https://content.cld.iop.org/journals/2043-6262/9/2/025006/revision1/ansnaabef8ieqn036.gif) [17]. However, at low cyanide concentrations as used in this work, maily only
[17]. However, at low cyanide concentrations as used in this work, maily only ![${{\left[ {\rm Ag}{{\left( {\rm CN} \right)}_{2}} \right]}^{-}}$](https://content.cld.iop.org/journals/2043-6262/9/2/025006/revision1/ansnaabef8ieqn037.gif) ions were formed [12].
ions were formed [12].
The gradual transformation of the SERS spectrum of the KCN when its concentration varies as shown in figure 3 can be explained as follows. Note that only cyanide ions  that are in contact with silver are capable of modifying (forming complexes with silver). At high cyanide concentrations, the ratio of these ions is low, so that the peak of the
  stretch at
  remains the main peak, with only the tail extending to the higher wave numbers. The lower the concentration of KCN, the greater the proportion of cyanide ions that can be modified by being in contact with silver. Thus the intensity of the peak at
  decreases continuously, while the peak at
  appears and gradually becomes more prominent with decreasing cyanide concentrations as shown in figure 3.
4. Conclusions
In conclusion, our studies have shown that the AgMFs@Si substrates which have been fabricated by chemical deposition, using AA as the reducing agent in the presence of PVP, can be used very well to detect cyanide traces (down to concentrations about 5 ppb) by SERS technique. It is worth noting, however, that if in experiments instead of ethanol, water was used to dilute cyanide (which is closer to reality, since cyanide is actually present in wastewater) then a part of silver in the SERS substrate would form a complex (or complexes) with cyanide. Like cyanide, this complex is also represented on the SERS spectrum by its bands. Thus in this case the concentration of cyanide will be characterized by the total intensity of the two bands, one representing cyanide and the other representing the silver-cyanide complex. More specifically, for the silver-cyanide system in the concentration range of interest in this work, the concentration of cyanide will be expressed as the total intensity of the band at  (representative for
  and the band at
  (representative for
 ![${{\left[ {\rm Ag}{{\left( {\rm CN} \right)}_{2}} \right]}^{-}}$](https://content.cld.iop.org/journals/2043-6262/9/2/025006/revision1/ansnaabef8ieqn046.gif) )).
)).
Acknowledgments
The authors express sincere thanks to Professor Nguyen Van Hieu for the valuable support. This work was supported financially by the Vietnam Academy of Science and Technology (VAST) under project NCVCC04.02/18-18.