


Abstract
Influence of Al-concentration on structure, magnetic properties and magnetocaloric effect of  (
( and 8) rapidly quenched ribbons was investigated. X-ray diffraction analysis shows that the ribbons exhibit single phase with a
  -cubic structure. Curie temperature,
  , of the alloy is slightly increased with increasing Al-concentration. Specially, the sample with
  has both the first- (FOPT) and second- (SOPT) order magnetic phase transitions. The reason for the FOPT in the alloy ribbons is due to existence of the structural transformation between martensitic and austenitic phases. The
  alloy owns both the positive and negative magnetocaloric effects with maximum magnetic entropy changes of
  and
and  (in magnetic field change
  ), respectively. By using Arrott-Noakes and Kouvel-Fisher methods, the critical parameters of the alloy were determined to be close to those of the mean field theory of long-range ferromagnetic orders.
Export citation and abstract BibTeX RIS

Original content from this work may be used under the terms of the Creative Commons Attribution 3.0 licence. Any further distribution of this work must maintain attribution to the author(s) and the title of the work, journal citation and DOI.
1. Introduction
In recent years, Ni-Mn-Z (Z = In, Ga, Sn...) Heusler alloys are of interest in research because they have a lot of interesting physical effects for both the basic research and application such as shape memory effect, magnetocaloric effect, barocaloric effect, magnetic superelastic effect [1–5]... Among them, magnetocaloric effect (MCE) has a great application potential in the field of magnetic refrigeration (saving energy and avoiding environmental pollution). Ni-Mn-Z Heusler alloys probably provide both the positive and negative magnetocaloric effects. The positive MCE is related to the second-order phase transitions (SOPT), and the negative MCE is related to the first-order phase transitions (FOPT). The existence of the FOPT in these alloys is due to the martensitic-austenitic structural phase transformation. This structural transformation can cause a large negative MCE (large magnetic entropy change  ) for the alloys, needed for application in magnetic refrigeration. Therefore, there have been many researches focusing on magnetocaloric effect in these alloys [6–9]. In series of these alloys, Ni-Mn-Sn is the most typical one. A negative giant magnetocaloric effect of Ni-Mn-Sn alloy was first reported by Thorsren Krenke et al [1]. According to these authors, the maximum magnetic entropy change (
 ) for this Ni-Mn-Sn alloy is as high as
  under the magnetic field change of 50 kOe at martensitic-austenitic transformation temperature. However, structure and properties of the Ni-Mn-Sn alloys are very sensitive with compositions and fabrication conditions. The magnetic mechanism and the desired MCEs for the alloys were achieved by adding other elements such as Ag, Cu, Co, Pr, Al, Gd... and changing fabrication conditions [9–13]. By using melt-spinning method to fabricate these alloys, the phase formations and MCEs of the alloys can be considerably improved. Therefore, in this work, we prepared
  alloys by melt-spinning method and investigated the influence of Al-concentration on their structure, magnetic properties and magnetocaloric effects.
2. Experimental
Alloy ingots with nominal compositions of  (
( and 8) were prepared from pure components of Ni, Mn, Al and Sn on an arc-melting furnace. The ingots were turned over and arc-melted five times to ensure their homogeneity. The ribbons were then fabricated on a single roller melt-spinning system with a velocity of the copper roller of
  . The ribbons have thickness of
  . In order to avoid oxygenation, all of the arc-melting and melt-spinning processes were performed under Ar atmosphere. Structure of the ribbons was analyzed by X-ray diffraction (XRD). Magnetization measurements in the temperature range of 77–400 K were performed on a vibrating sample magnetometer (VSM).
3. Results and discussion
Figure 1 presents XRD patterns of  (
( and 8) alloys recorded at room temperature. The structure analysis results show that the characteristic patterns of the samples are almost the same. The ribbons exhibit single phase with an austenitic
  -cubic structure with Miller-indexed peaks, belong to the space group Fm3m. This is in good agreement with previous studies. The martensitic-austenitic phase transition in Ni-Mn-Sn ribbons occurs at lower room temperature [14, 15]. Besides, we can also see that intensity of the diffraction peaks increases with increasing Al-concentration. Thus, the forming ability of phase with a
  -cubic structure is considerably improved by addition of Al.

Figure 1. XRD patterns of  (
( and 8) ribbons.
Download figure:
Standard image High-resolution imageIn order to investigate influence of Al on magnetic properties of the alloy, we measured the magnetization versus temperature and magnetic field. Figure 2 displays hysteresis loops of  (
( and 8) alloy ribbons at room temperature. From these hysteresis loops, both the coercivity
  and the saturation magnetization
  were obtained. All the samples have a soft magnetic feature with low coercivity less than 60 Oe (see inset of figure 2). This is desirable for active magnetic refrigeration because the magnetic hysteresis effect should be very small or negligible. The saturation magnetization of the alloy was slightly increased with increasing Al-concentration.
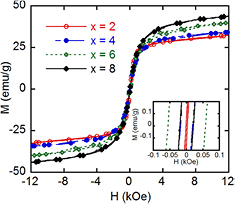
Figure 2. Hysteresis loops at room temperature of  (
( and 8) ribbons.
Download figure:
Standard image High-resolution imageThe temperature dependence of magnetization,  , for the samples in the field of 12 kOe is showed in figure 3. We see that the magnetic phase transitions of the alloy clearly depend on Al-concentration. With increasing temperature, the first-order martensitic-austenitic (M-A) phase transition only occurs at 172 K for the sample with
  . This transition of the samples with higher Al-concentration is not observed in the temperature range of 100–400 K. This can be explained by Al-addition contributed to development of the austenitic phase. According to various studies, the structure and magnetic properties of Ni-Mn based Heusler alloys have been found to be strongly correlated with valence electron concentration per atom (
 ), which is calculated as the concentration-weighted average of the valence electrons [16–18]. The addition of Al reduced the value of
  , therefore, the forming ability of phase with a
  -cubic structure is considerably improved by introducing small amount of addition of Al. Besides, the second-order magnetic phase transition takes place at around room temperature. It is the ferromagnetic-paramagnetic (FM-PM) transition of the austenitic phase [14, 15]. The FM-PM transition temperature (
 ) is increased with increasing Al-concentration. The
  values for the samples with
  and 8 are 315, 330, 347 and 360 K, respectively. The influence of Al on
  of the alloy can be explained by the dependence of
  on the exchange interaction in the materials. The ferromagnetic exchange interaction between Ni and Mn atoms in the Ni-Mn-Al alloys essentially decides value of their
  [19, 20]. Partial substitution of Mn by Al affects the exchange interaction of Ni and Mn atoms. Thus, the
  of the alloy is slightly increased with increasing Al-concentration.
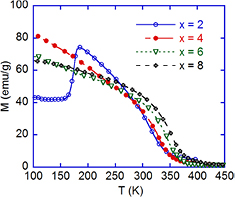
Figure 3. Thermomagnetization curves of  (
( and 8) alloy ribbons in an applied magnetic field of 12 kOe.
Download figure:
Standard image High-resolution imageAmong these samples, the  ribbon shows two strong magnetic phase transitions and has the
  near room temperature. Therefore, we chose this sample to investigate its MCE. We calculated magnetic entropy change (
 ) based on thermomagnetization curves of the ribbons at various magnetic fields ranging from 0.01 to 12 kOe (figure 4). The magnetic field dependence of magnetization,
  , at various temperatures (figure 5) was deduced from the thermomagnetization curves in various magnetic fields. According to our previous results [21, 22], to check this derivation procedure, we compared data deduced from thermomagnetization curve with those of virgin magnetization ones and we found that the data obtained from the two different ways are coincident. Then, the magnetic entropy change,
  , is determined from
  data at various temperatures by using the following equation:
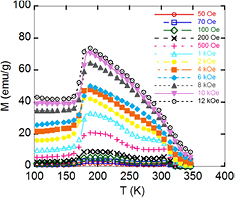
Figure 4. Thermomagnetization curves in various magnetic fields of Ni50Mn35Al2Sn13 ribbons.
Download figure:
Standard image High-resolution image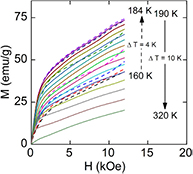
Figure 5. Magnetization versus magnetic field at various temperatures deduced from thermomagnetization curves of  ribbons.
Download figure:
Standard image High-resolution imageFigure 6(a) is temperature dependence of the magnetic entropy changes,  , of the
  ribbon under several magnetic field change (
 and 12 kOe). The
  curves of the sample have two extrema with opposite signs. One extremum corresponds to maximum of the positive MCE and the other is of the negative MCE. The positive MCE is related to the M-A transformation at
  and the negative MCE is due to the FM-PM transition at
  in the material. With
  , the maximum magnetic entropy change,
  , is about 2.6 and
  for negative and positive magnetocaloric effects, respectively. Here, the
  values of
  ribbons are quite close to those obtained for other Heusler alloys, such as
  [4],
[4],  [9],
[9],  [23]. In addition, the
  value increases with increasing magnetic field (figure 6(b)). The
  value of negative MCE is much larger than that of positive MCE. However, this value is only retained in a very narrow temperature range due to the nature of the FOPT of martensitic-austenitic phase transition. The full width at half maximum of entropy change peak (
 ) around
  is about 10 K, two times larger than that of the sample without Al addition reported in the previous studies [15]. Meanwhile,
  curve around
  is relatively broad due to the nature of the SOPT. Together with the magnetic entropy change, there is another useful parameter to assess the MCE. It is the refrigerant capacity (RC), which is defined as
  . The
. The  achieved for the
  alloy around
  and
and  is 26 and
  , respectively. Thus, it is possible to combine all the positive and negative MCEs of the material for magnetic refrigeration application. The
  alloy ribbons exhibit high positive MCE, which is distributed over a wide temperature range around room temperature, making the alloy become a good candidate for studies on the room temperature MCE.
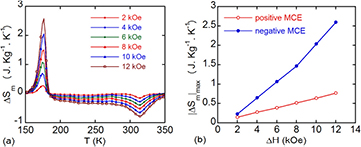
Figure 6. Temperature dependence of  (a) and magnetic field dependence of
  (b) of
  ribbons.
Download figure:
Standard image High-resolution imageIn order to understand the nature of the magnetic interactions in the alloys, we investigated their critical behavior around the FM-PM phase transition by using Arrott plots [24]. The Arrott plots,  versus
  (figure 7), were constructed from
  data. Because the FM-PM transition at Curie temperature is a continuous phase transition, values of the spontaneous magnetization (
 ) and the inverse initial susceptibility (
 ) at different temperatures could be derived from Arrott plots. The critical parameters
  ,
,  and
and  relate to the two above quantities by the following equations [24]:

where  and
and  are the critical amplitudes and
  is the reduced temperature.
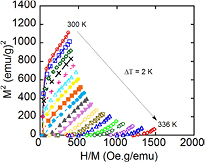
Figure 7.  plots at different temperatures of
  ribbons.
Download figure:
Standard image High-resolution imageThe  curves are non-linear at low magnetic field and linear at high magnetic field. The linear extrapolations from high magnetic field region to the intercepts with the
  and
and  axes give the values of
  and
and  , respectively. The
  and
and  parameters were obtained from fitting
  and
and  data (figure 8(a)) by using equations (2) and (3). Meanwhile,
  parameter can be calculated by using the Widom scaling relation [25]:


Figure 8. Temperature dependence of spontaneous magnetization  and inverse initial susceptibility
  (a) and Kouvel-Fisher plots (b) of the
  ribbons.
Download figure:
Standard image High-resolution image
As resulted, the  ribbons possess
  and
and  . Thus, this value of
  of the alloy is mostly equal to that directly determined from the thermomagnetization measurements. That means the procedures of deducing and fitting data are corrected. In comparison with some standard models such as mean field theory (
 and
and  ), 3D-Heisenberg model (
 and
and  ) and 3 D-Ising model (
 and
and  ) [26], our critical parameters obtained in this method for the
  ribbons are close to those of the mean field theory of long-range ferromagnetic orders. The sample has mainly long-range ferromagnetic orders. According to previous study [15], the
  ribbons display a short-range FM order with
  . Thus, the addition of Al plays an important role in establishing a long-range FM order in
  ribbons. The austenitic phase in these ribbons becomes more magnetically homogeneous.
Alternatively, the critical parameters can be obtained more accurately by the Kouvel-Fisher method [27]. Similar to Arrott-Noakes method,  and
and  are determined by plotting
  versus
  curves. The critical parameters
  and
and  relate to the two above quantities by these equations:


Again, the critical parameters  and
and  can be obtained from fitting
  and
and  data by using equations (5) and (6). Figure 8(b) shows Kouvel-Fisher curves of the
  ribbons with fitting results of
  and
and  . Based on the Widom scaling relation (4), the
  value was calculated to be 3.24. One can see that the critical parameter values determined from the Kouvel-Fisher method are in good agreement with those obtained by the Arrott-Noakes fittings. This proves the reliability of our achieved critical parameters.
4. Conclusion
The structure, magnetic and magnetocaloric properties of  (
( and 8) alloy ribbons have been studied. The ribbons exhibit single phase with a austenitic
  -cubic structure. All the alloy ribbons behave as the soft magnetic materials and their Curie temperature slightly increases with increasing Al-concentration. The maximum magnetic entropy change
  , with magnetic field change
  for the
  ribbon is 2.6 and
  for negative and positive magnetocaloric effects, respectively. Critical parameters of the alloy ribbons are close to those of the mean-field model for long-range ferromagnetic orders.
Acknowledgments
This work was supported by Vietnam Academy of Science and Technology under grant No. VAST.HTQT.NGA.05/17-18 and Russian Foundation for Basic Research under grant No. 17-58-540002. A part of the work was done in Key Laboratory for Electronic Materials and Devices and Laboratory of Magnetism and Superconductivity, Institute of Materials Science, Vietnam.