

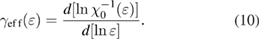
Abstract
Influence of the crystallite size on the magnetic and critical properties of  nanocrystals has been investigated. The results show that Curie temperature
  and magnetization slightly decrease with decreasing average crystallite size
  . Based on the mean-field theory and the magnetic-field dependences of magnetization at different temperatures
  , we pointed out that the ferromagnetic-paramagnetic phase transition in the samples undergoes the second-order phase transition with the critical exponents (
 ,
,  , and
, and 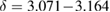 ) close to those of the mean-field theory. However, there is a small deviation from those expected for the mean-field theory of the values of
  ,
,  and
and  obtained for the samples. It means that short-range ferromagnetic interactions appear in the smaller particles. In other words,
  nanocrystals become more magnetically inhomogeneous with smaller crystallite sizes that could be explained by the presence of surface-related effects, lattice strain and distortions, which lead the strength of
  ferromagnetic interaction is decreased in the small crystallite sizes.
Export citation and abstract BibTeX RIS

Original content from this work may be used under the terms of the Creative Commons Attribution 3.0 licence. Any further distribution of this work must maintain attribution to the author(s) and the title of the work, journal citation and DOI.
1. Introduction
The colossal magnetoresistance (CMR) and the magnetocaloric (MC) effects discovered in doped rare-earth manganite perovskites (denoted as manganites)  (
( ...;
...;  ...) around the ferromagnetic (FM)-paramagnetic (PM) phase transition have attracted a great deal of interest due to their potential applications as field sensors, memory recording, magnetic reading heads, magnetic refrigeration, and novel electronic materials [1–6]. Earlier studies have also shown that the magnetic and transport properties of manganites depend on the double-exchange interaction of
  and
and  ions [7], the Jahn-Teller effect [8], the phase separation combined with percolation [9], as well as the oxygen deficiency [10]. However, the origin of the observed phenomena is still not fully understood. In the recent years, scientists have concentrated on the critical behaviour around the FM-PM phase transition of manganites in order to better understand the nature of the magnetic interactions and to derive the critical exponents (
 ,
,  and
and  ). The critical behaviour in the double-exchange interaction was described in a theoretical work by the long-range mean-field theory (MFT) with
  and
and  [11]. In 2000, Motome and Furulawa [12] used the computational technology to study the critical properties for some manganites. They suggested that their FM order is short-range one, which should belong to the 3D-Heisenberg model with
  and
and  [12]. Sequentially, a number of experimental studies on the critical properties of manganites also supported this viewpoint due to the determined value of the critical exponents close to those of the 3D-Heisenberg model. Phan et al [13] reported
  and
and  for
for  . These results are in good agreement with those earlier reported by Ghosh et al (
 and
and  for
for  ) [14] and Roesler et al (
 and
and  for
for  ) [15]. Whereas, a relatively high value of β determined in some manganites, such as
  (
( ) [16],
  (
( ) and
) and  (
( ) [17], and
 [18] is very close to that of the MFT. On the contrary, Shin et al [19] reported a very low value of β obtained in
  (
( ), which suggests that the magnetic phase transition in this material should be the first-order. Therefore, in view of the varied values of the critical exponents in manganites, the theoretical models including the mean-field model [11], the 3D-Heisenberg model [12], the 3D-Ising model [20], and the tricritical mean-field model [21] were used to explain their critical properties.
In a previous report, Thanh et al [22] have used the modified Arrott plot method to determine the critical exponents β, γ, and δ for  (PSMO) nanocrystals (NCs). They pointed out an existence of the long-range FM order in these compounds. However, in this work, using the MFT [11], the Kouvel-Fisher method [23], and
  data, the critical properties around the FM-PM transition of these PSMO NCs have been investigated in more detailed. We have also estimated their spontaneous magnetization values based on the magnetic entropy change data. Thereby, the value of exponent β can be predicted. Additionally, the range of the exchange interaction (σ), the correlation length critical exponent (ν), the heat capacity critical exponent (α), as well as the reduced temperature (
 ) dependences of the effective exponents
  and
and  for PSMO NCs have been also mentioned.
2. Experimental details
In the present work, we used samples that were taken from the similar batches investigated in a previous work [22]. Three samples of PSMO NCs with different crystallite sizes ( , 59, and 88 nm) were prepared by a combination of the solid state reaction and the mechanical ball milling methods with various milling times (
 , 20, and 10 min). Herein, the bulk samples were prepared by the solid state reaction method with a sintering process at
  for 48 h in air, using high-purity powders (
 )
)  ,
,  , and Mn. Next, these bulks were ground into powder, and then were used for the mechanical ball milling to make PSMO NCs. Detailed descriptions for this synthesis can be found elsewhere [22]. The structure analyses and the average crystallite size were carried out on an x-ray diffractometer (Bruker D8 AXS, Discover) and by using the Williamson-Hall method [24]. Magnetization isotherms
  were measured on a superconducting quantum interference device (SQUID) magnetometer in the range of
  and using a warming mode with a temperature interval of
  in the vicinity of
  . The applied magnetic field (
 ) has been corrected by a demagnetization factor (k) that has been determined by a standard procedure from
  data in the low-field linear response regime at low temperature (
 ) [25].
3. Results and discussion
As shown in figure 1(a), room-temperature x-ray diffraction (XRD) patterns proved a single phase of  , belonging to the orthorhombic structure (space group:
  ). Based on the XRD data, the average crystallite size (
 ) has been calculated through the Williamson-Hall method [24]. Figure 1(b) shows experimental data fitted to the Williamson-Hall relation for samples to estimate the
  values. Detailed descriptions for this content can be found elsewhere [22, 24]. As a result,
  values are obtained to be 39, 59, and 88 nm corresponding to
  , 20, and 10 min.

Figure 1. (a) Room-temperature XRD patterns and (b) Williamson-Hall analyses for PSMO NCs.
Download figure:
Standard image High-resolution imageIn an earlier report [22], we pointed out that PSMO NCs are soft magnetic materials. They undergo a second-order magnetic phase transition corresponding to  for
for  , respectively. Based on the magnetic-field dependences of magnetization
  measured at various temperatures [22], the temperature dependences of magnetic entropy change
  can be investigated via the thermodynamic Maxwell relationship [26]
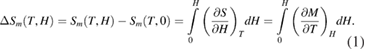
According to the thermodynamic theory, the relation between the heat capacity  and the magnetic entropy change of a material can be given as [26]
Therefore, the specific heat change  associated with a magnetic field change
  from 0 to H can be defined by

As shown in figures 2(a)–(c), all samples exhibit a MC effect around the magnetic phase transition. A maximum value of the magnetic entropy change appears on  curve. For each sample, this maximum value increases with increasing applied field. Based on
  data,
data,  data of PSMO NCs under several applied magnetic field changes
  has been calculated through equation (3) and performed in figures 2(d)–(f). All
  curves exhibit anomaly near
  due to the FM-PM transition. The value of
  strongly changes from the negative value to the positive one as temperature increases. With an enhancement of applied field, the
  value monotonically increases. For the applied field change of
  , the
, the  value is found to be about
  . Besides, both the changes of magnetic entropy and the specific heat decrease gradually with decreasing crystallite size
  from 88 nm to 39 nm. These reductions could be assigned to the enhancement of the nonmagnetic layer or spin disorder on the particle surface when particle size decreases [22].
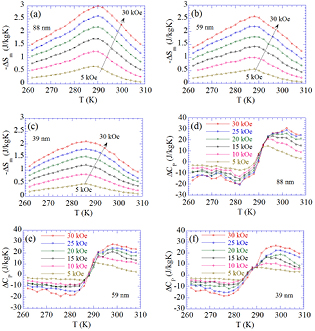
Figure 2. (a)–(c)  and (d)–(f)
  curves of PSMO NCs calculated under different applied field changes (
 with a step of
  ).
).
Download figure:
Standard image High-resolution imageTo get more information about the magnetic interactions in PSMO NCs, we used the MFT to determine the temperature dependences of spontaneous magnetization ( ). According to the MFT, in the FM region, the magnetic entropy change of a second-order material can be performed as a linear function of the magnetization (
![$\Delta {{S}_{m}}=f\left[ {{M}^{2}} \right]$](https://content.cld.iop.org/journals/2043-6262/9/2/025010/revision1/ansnaac42bieqn092.gif) ) [27]. Therefore, the value of the spontaneous magnetization at temperature T below
) [27]. Therefore, the value of the spontaneous magnetization at temperature T below  can be determined through the intersection of the straight line
 ![$\Delta {{S}_{m}}=f\left[ {{M}^{2}}\left(T \right) \right]$](https://content.cld.iop.org/journals/2043-6262/9/2/025010/revision1/ansnaac42bieqn094.gif) with the
with the  axis. Figures 3(a)–(c) perform
 ![$-\Delta {{S}_{m}}=f\left[ {{M}^{2}}\left(T \right) \right]$](https://content.cld.iop.org/journals/2043-6262/9/2/025010/revision1/ansnaac42bieqn096.gif) data at different temperatures in the FM region of PSMO NCs. Clearly,
data at different temperatures in the FM region of PSMO NCs. Clearly, ![$-\Delta {{S}_{m}}=f\left[ {{M}^{2}}\left(T \right) \right]$](https://content.cld.iop.org/journals/2043-6262/9/2/025010/revision1/ansnaac42bieqn097.gif) data at different temperatures exhibit a set of linear dependences. However, these straight lines are not absolutely parallel, and their divergence increases when crystallite size decreases. This suggests that the magnetic interactions in PSMO NCs do not fully belong to the MFT.
data at different temperatures exhibit a set of linear dependences. However, these straight lines are not absolutely parallel, and their divergence increases when crystallite size decreases. This suggests that the magnetic interactions in PSMO NCs do not fully belong to the MFT.

Figure 3. (a)–(c)  versus
  data obtained at different temperatures below
  , the solid lines are linear fittings of the
  . (d)–(f)
  data obtained from the linear extrapolation of the
  , the solid lines are fitting curves of
  data to equation (4).
Download figure:
Standard image High-resolution imageFigures 3(d)–(f) show the  data (symbols) for PSMO NCs, which are determined from the intersections of the linear extrapolation lines of
 ![$-\Delta {{S}_{m}}=f\left[ {{M}^{2}}\left(T \right) \right]$](https://content.cld.iop.org/journals/2043-6262/9/2/025010/revision1/ansnaac42bieqn106.gif) at several temperatures in the FM region with the
at several temperatures in the FM region with the  axis. With increasing temperature, the spontaneous magnetization of PSMO NCs monotonously decreases. Based on the power law of the spontaneous magnetization in the temperature region near the FM-PM phase transition [11]
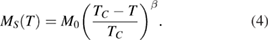
To determine the value of critical exponent β, which describes how the order moment grows below  of PSMO NCs, we fitted their
  data to equation (4), see the solid lines in figures 3(d)–(f). By this way, we obtained the values of
  (
( , and
, and  for
for  , 59, and 39 nm, respectively) and β (
 , and
, and  for
for  , 59, and 39 nm, respectively). We can see that the value of critical exponent β obtained for PSMO NCs is very close to that of the MFT (
 [11]). It means that FM order in the samples is the nearest long-range FM order. However, the reduction in value of β in the samples with smaller crystallite sizes suggests a small deviation from the MFT.
To evaluate more accurately the value of the critical parameters, we used the Kouvel-Fisher method, which can independently determine the value of the critical exponents β and γ through the Kouvel-Fisher plots [28]. According to this method, the relationship between the spontaneous magnetization  , the initial susceptibility
  , the critical exponents β and γ, and temperature T can be defined as [23]
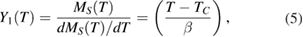
Because  and
and  around Curie temperature of the second-order phase transition obey the power laws with the exponents β and γ, both
  and
and  plots should be straight lines in the critical region, and the slopes of
  and
and  lines give the values of β and γ [28]. Based on
  data measured at different temperatures in the critical region,
  and
and  data have been determined and performed in figures 4(a)–(c). Herein, the straight lines are linear fits
  and
and  data to equations (5) and (6) for PSMO NCs. The critical parameters of the samples are found to be
  ,
,  , and
, and 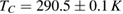 for
for  ;
;  ,
,  , and
, and  for
for  ; and
; and  ,
,  , and
, and  for
for  . For the third critical exponent δ (associated with the critical isotherm), it can be calculated by using the obtained values of β and γ via the Widom scaling relation [11]
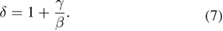

Figure 4. (a)–(c) The Kouvel-Fisher plots and (d)–(f)  versus
  at different temperatures in the critical region.
Download figure:
Standard image High-resolution imageBy this way, δ value for PSMO NCs is found to be 3.071, 3.164, and 3.304 for  , 59, and 39 nm, respectively. To check the reliability of the obtained critical parameters, we have used the scaling function of magnetization data [29]
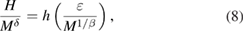
where h and  are the scaling function and the reduced temperature, respectively. Equation (8) implies that the scaled
  versus
  (with
(with  is the gap exponent) will collapse onto a universal curve with all experimental data points if we used the appropriate values of the critical parameters [29]. Thus, in this work, the values of the critical parameters (β, γ, δ, and
  ) obtained from the Kouvel-Fisher method as mentioned above have been used to construct
  versus
  and performed in figures 4(d)–(f). Clearly, most of
  data points in the critical region of PSMO NCs fall onto a universal curve. This result confirms that the obtained value of β, γ, δ, and
  are appropriate.
In comparison with the critical exponents of the theoretical models (the mean-field model  and
and  [11], the 3D-Heisenberg model
  and
and  [12], the 3D-Ising model
  and
and  [20], and the tricritical mean-field model
  and
and  [21]) the values of the exponents obtained for PSMO NCs are quite close to those expected for the MFT. This proves the existence of a long-range FM order in the samples. However, the values of β obtained for the samples are smaller than 0.5, suggesting an existence of the magnetic inhomogeneities, which can be explained by the contribution of the nonmagnetic layer and/or spin disorder on the surface of the nanoparticles, which leads to the weakening of the double-exchange interaction strength [30].
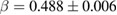
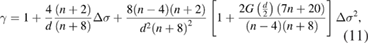
Zhang and co-workers [31] pointed out that a small deviation of the critical exponents from the values of the theoretical models often appears in a magnetic system that is governed by various competing coupling and/or disorders. Therefore, the critical exponents belonging to any universality class in the asymptotic region should be investigated. To further testify the convergence of the critical exponents for PSMO NCs, we calculated their effective exponents  and
and  via the relations [31]
Using equations (9) and (10), the reduced temperature dependences of the effective exponents  and
and  of PSMO NCs are calculated and presented in figure 5. This exhibits a non-monotonousness of
  and
and  versus ε, suggesting that
  and
and  of PSMO NCs do not match any theoretical universality classes. However, when temperature is approaching
  , the values of
  and
and  for
for  and 59 nm approach the values expected for the MFT (figures 5(a) and (b)), whereas
  and
and  of
of  shift to the values located in between those of the MFT and the 3D-Heisenberg or 3D-Ising models (figure 5(c)). The non-monotonousness of
  and
and  versus ε observed for our samples agrees with earlier report for
  compound by Pramanic and Banerjee [32], who suggested that the non-monotonic changes of
  and
and  were attributed to magnetic disorders in the samples. In a recent report, Zhang et al [31] commented that the non-monotonic changes of
  and
and  are an intrinsic property because the critical exponents of a homogeneous magnetic system are independent of the microscopic details, which is due to a divergence of the correlation length in the asymptotic critical region.

Figure 5. The reduced temperature dependences of the effective exponents  and
and  in the asymptotic region.
Download figure:
Standard image High-resolution image
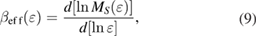
According to Fisher and co-workers [33], the universality class of a homogeneous magnetic system exhibiting the second-order phase transition depends on the range of the exchange interactions (σ), which appears in the exchange integral  , where r is the distance, d is the spatial dimensionality. For homogeneous magnets with dimensionality d and spin n, the range of the exchange interactions σ can be calculated via the relation [31]
where  and
and 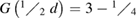
 . For three-dimensional materials (
 ), the exchange integral can be defined as
  . The Heisenberg model is valid for the 3D isotropic ferromagnet when
  , where the exchange integral
  decreases faster than
  . Meanwhile, the MFT is valid for
  . It means that the exchange integral
  decreases more slowly than
  . And in the range
  , the system follows different class depending on the value of σ [33]. For our case, the value of γ obtained from the Kouvel-Fisher method as mentioned above has been used to calculate the range of the exchange interaction σ for PSMO NCs. Thus σ value of the samples whenever
  and
and  is found to be 1.542, 1.589, and 1.594 for
  , 59, and 39 nm, respectively. Clearly, these values are very close to
  that is expected for the MFT. This result suggests that the exchange interactions in PSMO NCs obey the MFT, which is valid for the long-range FM orders.
Additionally, the remaining critical exponents including the correlation length (ν) and the heat capacity (α) critical exponents have also been calculated via the below relations [34]
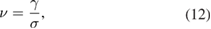

Using equations (12) and (13), the values of ν and α are found to be  , and 0.666 and
  , 0.005, and 0.002 for
  , 59, and 39 nm, respectively. These results seem to be in agreement with the predicted one for the MFT (
 ) [34]. The self-consistency of the critical exponents determined for the samples proves that their values are reliable and unambiguous.
4. Conclusion
In summary, we have prepared the nanosized  polycrystalline samples with
  by a combination of the solid state reaction and the mechanical ball milling methods during
  min. Based on the magnetic entropy change data, the spontaneous magnetization of samples can be determined. By this way, the exponent β can be easily estimated. The analysis based on the Kouvel-Fisher method shows that the samples undergo the second-order phase transition with the values of the critical exponents (
 ,
,  , and
, and  ) approximating the values of the MFT. This suggests that the FM order in the samples is long-range order. Besides, the reduction of the exponent β in the samples with smaller crystallite sizes has also been observed (
 and 0.461 for
  and 39 nm, respectively). This proves an existence of the magnetic inhomogeneities. We have pointed out the non-monotonousness of
  and
and  in the asymptotic region of all the samples. These non-monotonic changes are ascribed to magnetic disorders in the samples.
Acknowledgments
This research is funded by Vietnam National Foundation for Science and Technology Development (NAFOSTED) under grant number 103.02-2015.06.