

Abstract
The present study describes preparation of  doped activated carbon (NAC), employing waste orange peel as carbon source, melamine as nitrogen dopant and KOH as activating agent. The prepared NAC samples were textually characterized using the techniques of surface area and pore size analyzer, scanning electron microscopy (SEM), x-ray diffraction (XRD) and Raman spectroscopy. As evident from characterization results, the synthesized NAC materials own porous structure and offers high surface area
  , and pore volume
  . Such useful characteristics of NAC indicate its suitability as electrode for supercapacitors. Electrochemical performance of NAC material was evaluated in 6 M KOH aqueous solution, employing the standard electrochemical avenues of analysis. It was found that synthesized NAC sample exhibits high specific capacitance
  , specific energy
  and specific power
  at current load of
  . The better electrochemical performance of the NAC is probably due to enhanced surface area and availability of nitrogen functional groups. Thus, the porous structure and nitrogen-doping characteristics make NAC a potential electrode material for applications in the field of supercapacitors.
Export citation and abstract BibTeX RIS

Original content from this work may be used under the terms of the Creative Commons Attribution 3.0 licence. Any further distribution of this work must maintain attribution to the author(s) and the title of the work, journal citation and DOI.
1. Introduction
Keeping in view the degradation of fossil fuels, environmental conservation issues and increasing demand of energy, new alternative sources of energy are being searched by investigators. Solar energy and wind energy are a few sources, which could be of enormous help in addressing the above issues, if their proper management and storage is addressed [1]. Batteries and capacitors are two storage devices commonly used for energy storage [2]. Batteries have sufficient energy density but smaller power density. On the other hand, capacitors have sufficient power density but limited energy density [3]. The gap of energy and power density between batteries and capacitors has been successfully bridged in previous years using supercapacitors [3, 4]. Supercapacitors, also referred as electrochemical capacitors, are devices which along with moderate energy density and high power density are capable of providing high charging and discharging rates, with extraordinary cycling stability [3, 5]. Owing to these useful characteristics, supercapacitors are employed in numerous applications such as hybrid electric transport, military devices, memory-backup devices, hybrid electric vehicles, and space accessories [3, 4, 6]. In regard to energy storage mechanism and electrode material, supercapacitors can be classified into two types. These are commonly identified as electric double layer capacitors (EDLCs) and pseudocapacitors [3]. EDLCs make use of various forms of carbon as electrode material, and charge storage takes place electrostatically at the electrode-electrolyte interface [7–9]. On the other hand, in pseudocapacitors, the electrode materials are transition metal-oxides and conducting polymers, and capacitance is due to fast-faradaic reactions occurring at the surface of electrode and electrolyte ions [10–14].
In recent times, the activated carbon due to its large surface area, affordable cost and availability of standard synthesis methods, is most commonly used electrode material for EDLCs [15]. Natural and renewable biomass can be profitably used as carbon precursor [16]. Activated carbon has been previously prepared from various biomass sources. They include pine-apple leaves [17], neem leaves [18], walnut shells [19], rotten carrot [20], oil palm empty fruit bunches [21], and pea skin [22]. However, the values of specific capacitance and energy density observed for these AC based electrodes are found to be limited [23]. The magnitudes depend on the carbon precursor, activation agent and duration of activation time, selected for synthesis [24].
For preparation of activated carbon, commonly used activating agents include  and KOH. Even though NaOH and KOH are similar compounds, complete identity results (using KOH or NaOH activation) is not necessarily same. This is because the reaction mechanisms of these two hydroxides are different. KOH intercalates between carbon layers, while NaOH reacts with the most energetic sites of the surface, thus displaying a reactivity which strongly depends on the aromaticity and crystallinity of the carbonaceous precursor. In reported literature, the effect of KOH and NaOH on the properties of activated carbon has been investigated and it was concluded that in comparison to NaOH, KOH offers suitable material and electrochemical properties [25].
Irrespective of the activating agent used it was found that ACs possessing low graphitization degree suffers from poor electric conductivity, restricting the possibility of fast charging-discharging [26]. However, reported investigations indicate that on modifying the synthesized carbon material with heteroatom species, the conductivity of carbon material is enhanced. It would also bestow carbon with nitrogen and oxygen functionalities [27]. This increases the wettability between electrolytes and electrodes, and along with double layer capacitance, helps in introduction of additional pseudocapacitance due to redox reaction, thus increasing the overall capacitance [28]. Nitrogen-doped carbons are generally synthesized by treatment of chemical agents such as urea, melamine and amines with carbon sources such as biomass materials and organic polymers followed by activation process [28, 29]. Nitrogen-rich porous carbon material employing hydrochar as precursor, melamine as nitrogen source and KOH as activating agent have been reported by Gao et al [30]. Using direct pyrolysis of solid melamine-formaldehyde (MF), nitrogen-doped hollow carbon microspheres with graphitic carbons shells have been reported by Ma et al [31]. It was concluded by investigators that for synthesizing nitrogen-doped carbons the optimum ratio of carbon precursor to melamine should be unity [28, 29].
As discussed above, activated carbon has been synthesized from numerous biomass sources [17–22]. One such source is orange peel (OP). There are a few studies on the synthesis of activated carbon from OP [32–36]. However, to the best of our knowledge, no study on NAC (employing OP as carbon source) has been reported.
In the present work, NAC with high specific surface area  and pore volume
  has been synthesized, using melamine assisted chemical activation procedure. NAC was synthesized using OP, melamine and KOH as raw material, nitrogen dopant and activating agent. The supercapacitive performance of the synthesized NAC material was studied in 6 M KOH aqueous solution. It was found that NAC material exhibits high specific capacitance
  , specific energy
  and specific power
  at current load of
  .
.
2. Experimental details
2.1. Materials
OP was collected from Ambrosia Apiaries Pvt. Ltd located in Mohamadpur, Delhi, India. Melamine,  and
and  were acquired from Sigma Aldrich. All solutions were prepared using DI water.
2.2. Preparation of NAC
Briefly, OP was torn into small pieces, subsequently washed with DI water and dried in an oven at  for 12 h. The dried OP was then crumpled to fine powder. Obtained powder form and melamine were mixed in a weight ratio of 1:1 and thereafter the mixture was carbonized at
  for 2 h under inert atmosphere. The resulting product, subsequent to carbonization was marked nitrogen-doped carbon (NC). The ramp rate selected for increase in temperature was
  . The synthesized NC was mixed with KOH in a mass ratio of 1:1 and thereafter subjected to heat in tube furnace at
  for 2 h, under inert atmosphere. The ramp rate selected for increase and decrease in temperature was
  . As soon as the temperature of tube furnace matched room temperature, synthesized sample was removed from tube and washed with 10% HCl, followed by repeated washing with warm DI water, until filtrate shows neutral pH. The resultant product was marked as NAC-1. To evaluate the effect of activating agent, synthesized NC was mixed with KOH in varying mass ratios of 1:2 and 1:3. The resultant mixture was annealed and washed using the same process and resultant samples were marked as NAC-2 and NAC-3.
2.3. Material characterization
To study the pore structure parameters of the synthesized samples, surface area and pore size analyzer (GEMINI V, Micromeritics, USA) was employed. The content of nitrogen in NAC samples was investigated using elemental analyzer (Vario Micro Cube, Germany). The surface morphology of sample was studied employing scanning electron microscopy (FESEM, MIRA3 TESCAN). For determining crystal structure, synthesized sample was scanned in the range of  to
to  at 0.02 steps employing x-ray diffractometer (XRD, Bruker D8, USA). Raman spectrophotomter (Horiba Yvon) having wavelength of 488 nm was used for Raman measurements.
2.4. Electrochemical characterization
For preparation of working electrodes, active material NAC, conducting additive acetylene black (10%) and binder PVdf-HFP (5%) were mixed in the mass ratio of 85:10:5 and the resultant mixture was layered on flexible graphite sheets. This was followed by drying the graphite sheets at  (in vacuum oven), overnight. The average value of mass loading was 1.6 mg. Aqueous solution of 6 M
  was used as electrolyte. Symmetric supercapacitor cells were fabricated using two identical electrodes separated by electrolyte soaked filter paper. The performance of fabricated capacitor cells was studied using the techniques of electrochemical impedance spectroscopy (EIS), cyclic voltammetry (CV) and galvanostatic charge-discharge (GCD). Employing CH Instruments (CHI-600E, USA), CV and EIS measurements were performed. CV measurements were done for varying potential range as well as scan rates while EIS measurements were carried out in the frequency range of 10 mHz to 100 kHz; at an amplitude of 10 mV. Employing charge-discharge analyzer (BT-2000, Arbin Instruments, USA), GCD measurements were taken for different amplitude as well as different current density. The specific capacitance value of the fabricated capacitor cell for each measurement method was evaluated using the given formulas:
  for CV,
  for EIS and
  for galvanostatic charge-discharge techniques. Here,
  ,
,  ,
,  ,
,  ,
,  ,
,  ,
,  , and
, and  denote the average current, scan rate, active mass in single electrode, angular frequency, imaginary impedance at 10 mHz, applied current, discharge time and discharge voltage, respectively.
3. Results and discussion
3.1. Characteristics of electrode material
The surface area and pore structure parameters of various NAC samples were evaluated from  adsorption-desorption isotherm at 77 K. As evident from figure 1(a), the nature of the isotherm for all the samples, is similar to the type I curve, as prescribed by IUPAC. This indicates the microporous nature of the prepared samples. Values of porous parameters of synthesized NAC samples (such as average pore size, total pore volume and BET surface area) are recorded in table 1.
Table 1. Values of pore structure parameters and nitrogen content in synthesized NAC samples.
| Composition (NC: KOH) | BET surface area  |
Micropore surface area  |
Mesopore surface area  |
Micropore volume  |
Total pore volume  |
Mesopore volume  |
Average pore size (nm) | Nitrogen content (%) |
|---|---|---|---|---|---|---|---|---|
| NAC-1 | 1266.11 | 516.68 | 749.43 | 0.2679 | 0.6649 | 0.3970 | 2.10 | 3.92 |
| NAC-2 | 1577.27 | 950.65 | 626.62 | 0.4867 | 0.8714 | 0.3847 | 2.07 | 3.11 |
| NAC-3 | 1351.85 | 643.97 | 707.88 | 0.3326 | 0.7052 | 0.3726 | 2.09 | 2.74 |
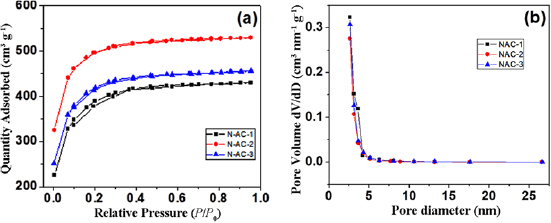
Figure 1. (a)  adsorption-desorption isotherms and (b) pore size distribution of nitrogen doped activated carbons synthesized at different impregnation ratio.
Download figure:
Standard image High-resolution imageFrom the observed magnitudes of pore structure parameters, it was found that prepared NAC-2 sample offers high BET surface area and total pore volume. As large surface area can provide numerous sites for storage of electrolyte ions, such good pore structure makes synthesized sample attractive candidate for energy storage applications. It may be noted from table 1, that with the increase in impregnation ratio of  to NC from 1 to 2, increment in values of pore structure parameters is observed.
However, with further enhancement (i.e. from 2 to 3), the decrease in such parameters was observed. This clearly shows the dependence of porosity on impregnation ratio. Figure 1(b) shows the pore size variation among various NAC samples, calculated using BJH(Barrett-Joyner-Halenda) theory. It was observed that all NAC samples show pore size distribution in the range of 2 − 5 nm which is in accordance with the results, observed using sorption isotherm. The nitrogen content present in the synthesized NAC samples was evaluated from elemental analyzer. The percentage of the nitrogen present in the samples is listed in table 1. From the observed values, one may clearly note the dependence of nitrogen doping on impregnation ratio. Nitrogen doping in the synthesized sample decreases, with the increase in the ratio of activating agent. This is accordance with the reported literature [37]. Since, the sample NAC-2 offers the highest values of specific surface area and pore volume, and moderate nitrogen doping in comparison to the samples NAC-1 and NAC-3. Hence, further detailed study on its surface morphology, crystal structure and vibrational response, and capacitance properties was carried out.
Figure 2 presents the SEM images of carbon precursor and NAC recorded at varying magnification. The observed images of the raw material indicate crumpled sheet like structure with thin strips. In contrast, the images for NAC show the presence of porosity in the synthesized material. The observed image shows that the material has skeleton structure with various cavitations. Such morphology (i.e. presence of cavities) is significant, in relation to energy storage. The cavities can be helpful in storage of electrolyte ions.

Figure 2. SEM images of ((a) and (b)) raw material and ((c) and (d)) optimized NAC at different magnification.
Download figure:
Standard image High-resolution imageXRD pattern of NAC-2 is shown in figure 3(a). The observed pattern shows a couple of characteristic peaks centered nearly at  and
and  . The peaks can be ascribed to (002) and (100) planes of graphitic carbon and reveal the non-crystalline nature of the sample NAC-2. Figure 3(b) presents Raman spectra for NAC-2. Two characteristic peaks near
  and
and  are seen in the spectra. These peaks are popularly referred to as D-band and G-band. D-band is associated with disordered carbon structure while G-band refers to ordered lattice of carbon material. The D band indicates the suitability for charge storage, while the G band is responsible for good electrical conductivity. The calculated intensity of D-band to G-band (
 ) ratio was found to be 0.91. This indicates the formation of structural defect graphitized carbon. The observed results are in consonance with conclusions obtained using XRD.

Figure 3. (a) XRD pattern and (b) Raman spectra of NAC-2.
Download figure:
Standard image High-resolution image3.2. Electrochemical performance of electrode material
As discussed in section 2.4, the two-electrode supercapacitive performance of the synthesized NAC-2 was tested in 6 M KOH aqueous solution using standard electrochemical avenues of analysis. For evaluating the operating potential of the capacitor cell, cyclic voltammetry plots of fabricated capacitor cell in varying potential range  at a constant scan rate of
  were recorded.
They are depicted in figure 4(a). It was observed that the trend of CV curves exhibits almost rectangular behavior up to 0.8 V, indicating that the device can be safely operated till 0.8 V. However, for potential exceeding 0.8 V, deviation from rectangular shape was observed for CV curve. This limited operating potential of cell is primarily due to limited ESW(electrochemical stability window) of aqueous electrolyte. The functioning of the capacitor cell was assessed in the operating potential range  with increasing scan rate (as shown in figure 4(b)). The shape of the CV plots remained almost rectangular, even for high scan rates of
  , indicating appreciable rate capability of the cell. This high rate capability is an indication of good electrical double layer capacitor behavior and excellent ions responsitivity. The values of specific capacitance
  of cell were evaluated by varying scan rates and are shown in figure 4(c). It has been observed from the calculated values that as-synthesized NAC sample offers high specific capacitance of
  at
at  , which is more in comparison to the results found in literature [21]. This high capacitance value is due to high surface area as well as nitrogen doping. These features of NAC not only enhance its conductivity and ion diffusion capacity but also helpful in achieving fast ion transfer pathway and pseudocapacitance [38]. It was also observed that with the increase in scan rate, there was decrement in the value of
  . This common observation has been previously marked and is primarily due to limited access of active electrode sites by electrolyte ions, with increase in scan rate [12].
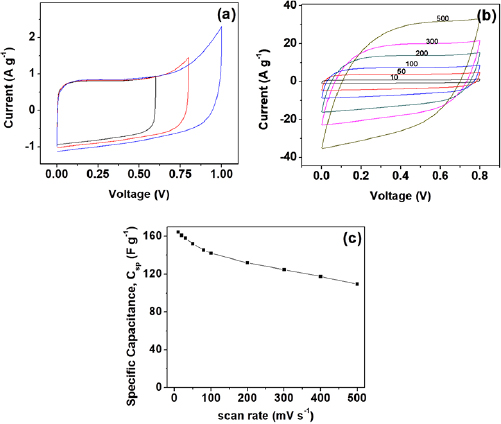
Figure 4. Cyclic voltammogram of capacitor cell with increasing (a) potential window at a scan rate of 10  , and (b) scan rates for constant potential window. (c) Variation of specific capacitance of capacitor cell as a function of scan rate.
Download figure:
Standard image High-resolution imageElectrochemical behavior of fabricator capacitor cell and role of electrolyte was assessed using EIS techniques. Figure 5(a) depicts the Nyquist plot for the capacitor cell. On the basis of frequency variation, the observed plot can be divided into three regions, namely: low, mid and high. In low frequency region, fabricated cell exhibits almost similar steep rise (almost approaching  ). This is an indication of good capacitive behavior of the cell, which is due effective contact between electrode and electrolyte. Expanded view of the plot in high frequency region has been depicted as inset. Crucial electrical characteristics of the cells related with electrolyte as well as electrode-electrolyte interface were investigated in this region and are given in table 2.
Table 2. Various electrochemical parameters of the capacitor cell evaluated from impedance analysis.
  |
  |
  |
  |
Response frequency,  |
Response time,  |
Available specific energy,   |
Pulse power,   |
|---|---|---|---|---|---|---|---|
| 1.53 | 1.87 | 19.26 | 149.62 | 0.51 | 1.96 | 4.59 | 8.43 |
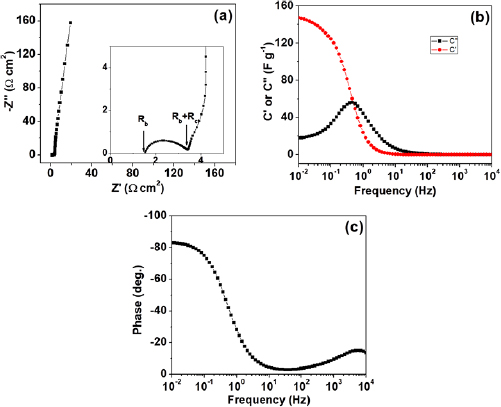
Figure 5. (a) Nyquist plots of the capacitor cell. Expanded representation of the plot, indicating the bulk resistance  and charge-transfer resistance
  of the cells (marked by arrows) is shown as inset, (b) capacitance (
 and
and  ) variation as a function of frequency, (c) bode phase angle of capacitor cell.
Download figure:
Standard image High-resolution imageLow magnitude of  and
and  shows the proper formation of electrode-electrolyte contact, and the diminished resistive route followed by electrolyte ions. The magnitude of specific capacitance
  calculated 10 mHz frequency, was found to be in agreement with CV results.
The values of complex capacitance ( and
and  ) were found using the following equation:
where,  and
and  are respectively real and imaginary part of impedance and
  is angular frequency.
Figure 5(b) shows the complex capacitance ( and
and  ) plots varying with logarithm of frequency. As frequency increases, decrement in value of
  was observed. At very high frequency, supercapacitor shows the characteristic of pure resistor. Many parameters (such as the nature of the electrolyte used and electrode thickness) are responsible for this transition, in the value of
  . In the context of energy dissipation,
  changed with frequency and then reached its maximum value. It may be inferred from the plots that the magnitude of
  become greater with decrease in frequency, whereas the value move towards higher frequency in the case of
  . This indicates good capacitive behavior of the capacitor cell. The point at which the plots of real and imaginary parts of capacitance (i.e.
  and
and  ) cross each other, provides the value of response frequency
  [39]. The characteristic response time
  is inverse of response frequency and determines the rate capability of device. Employing characteristic response time, the pulse power density for capacitor cell was evaluated employing the given expression:
  . Here,
  is the specific energy calculated at
  [40]. The calculated values of
  and
and  for the cell are given in table 2. The observed values of pulse power density are high, indicating good rate capability of cells. Presence of good rate capability has also been seen during CV studies. Figure 5(c) presents the Bode phase angle plots for the capacitor cell. At low frequency, the capacitor cell phase angle is
  which is near
  (characteristic of idealized capacitor). This indicates capacitive behavior of cell.
As the measurements from CV and EIS are sometimes unreliable. Hence, for more accurate capacitive measurements, galvanostatic charge-discharge curves were noted, at room temperature, for varying values of current density. Figure 6(a) shows the typical charge-discharge curves for the capacitor cell, with varying voltage amplitude. Standard capacitive (nearly triangular shaped) charge-discharge characteristics for the cell indicate its capacitive nature. Subsequent to an early ohmic drop, nearly linear discharge patterns were observed. Performance of the cell was also evaluated at varying values of current density. It was noted that usual capacitive charge-discharge pattern were preserved, even when current density was large, indicating good rate capability of cell. Using the linear discharge curve, equivalent series resistance (ESR) and specific discharge capacitance  values for the cells were calculated and are recorded in table 3.
Table 3. Charge-discharge characteristics of the capacitor cell at the current load of  .
.
ESR  |
Specific capacitance  |
Specific energy  |
Specific power  |
|---|---|---|---|
| 9.75 | 166.83 | 5.79 | 9.50 |

Figure 6. Galvanostatic charge-discharge curves of capacitor cell with increasing (a) voltage at a constant current load of  , and (b) current load at constant voltage. (c) Variation of discharge capacitance as a function of increasing current load. (d) Ragone plot for the capacitor cell.
Download figure:
Standard image High-resolution image
The noted values of  are in consonance with those found from CV and EIS results. It was noted that even with increase in current density, capacitor cell possess sufficient capacitance, showing good rate capability of cell. CV and EIS studies, discussed earlier also showed good rate capability. The magnitude of specific energy
  and specific power
  for the cell were calculated by the equations:
  and
and  . The noted values are recorded in table 3. Figure 6(d) shows the comparative specific energy variation with specific power (i.e. Ragone plots) for the capacitor cell. The observed shape of Ragone plot is quite similar to the shape reported in literature [10, 12] and the values are much higher than previously reported values [21]. These characteristic of NAC render it a potential possibility to be employed as an efficient electrode for storing energy.
4. Conclusions
In this work, preparation and electrochemical performance of NAC have been discussed. NAC was prepared using melamine assisted chemical activation technique with orange peel as raw material, melamine as nitrogen dopant and KOH as activating agent. The effect of activating agent on porosity of NAC was investigated employing surface area and pore size analyzer. It was found that optimized NAC (i.e. NAC-2) offers high values of surface area  and total pore volume
  . The electrochemical performance of NAC was tested in two-electrode assembly using aqueous solution of 6 M KOH, as electrolyte. It was established that NAC offers capacitance as high as
  at
at  and
and  at
at  . Additionally, the fabricated symmetric cell offers high specific energy
  and specific power
  , indicating the possible use of NAC for energy storage application in an environment friendly manner.
Acknowledgments
We are grateful to Prof S A Hashmi, Department of Physics and Astrophysics, University of Delhi. He provided materials and facilities used for the investigation. One of us (Sultan Ahmed) is grateful to the University Grants Commission, New Delhi for granting him Senior Research Fellowship.