

Abstract
The continuous search for effective and efficient engineered materials towards solving human challenges is in continuous needs. This study reports the preparation of  alumina from kaolin as catalyst support using methanol as precipitant for the synthesis of multiwalled carbon nanotubes (MWCNTs) in a horizontal chemical vapour deposition (CVD) reactor. The process involved thermal treatment of kaolin in a static air furnace, leaching of the treated kaolin in tetraoxosulphate(VI) acid
  , precipitation in methanol medium, washing in distilled water and calcination at
  . The alumina in the kaolin was successfully leached and a cubic structure
  alumina of high thermal stability was synthesized. The
  alumina was then characterised and utilised as support for the bimetallic catalyst (Fe-Ni) using wet impregnation method. The produced catalyst was used to produce CNTs in a CVD reactor. The thermal properties, surface morphologies, surface functional groups, crystallinity, elemental analyses, and surface areas of the starting kaolin,
  alumina, prepared bimetallic catalyst (Fe-Ni/
 alumina) and the synthesized MWCNTs were determined using TGA/DTA, HRSEM, FTIR, XRD, EDX, and BET respectively. The XRD analysis of the bimetallic catalyst was employed to determine its average crystalline particle size to be 26.23 nm using Scherer equation. Tip growth mechanism of MWCNTs was observed during the MWCNTs nucleation process with 41.2 nm external diameters,
  length and 340 aspect ratio using dynamic light scattering (DLS) technique. The purified MWCNTs showed high antibacterial activities at long exposure time. The results of the various analysis conducted show that the synthesized
  alumina has potential properties as catalyst support for MWCNTs growth via CVD technique.
Export citation and abstract BibTeX RIS

Original content from this work may be used under the terms of the Creative Commons Attribution 3.0 licence. Any further distribution of this work must maintain attribution to the author(s) and the title of the work, journal citation and DOI.
1. Introduction
Materials researchers have greatly intensified effort on structural and morphology dependant synthesized materials. The interest of many researchers is currently being channelled towards the synthesis of inorganic oxides such as  ,
,  , alpha-
 and alumina [1–4]. Aluminium oxide based materials are among the promising amphoteric materials, and are important oxide materials in industry due to their exceptional chemical and physical performances. Such exceptional performance includes high fracture toughness, excellent abrasion resistance, high insulation, transparency, high bending strength, high hardness, high dielectric strength at high voltage, thermal stability with a melting point of
  , and high resistance to chemical attack [5]. These characteristics enable alumina to be used as raw material for structural, optical, biomaterial, and electrical purposes [6, 7]. Hence, γ-alumina is mostly employed in the area of adsorption and catalyst support due to its textual characteristics and improved mesoporous morphology [8–10]. This is as a result of its improved properties such as high thermal stability, surface area, pore volume, pore size, its amphoteric property and hydrolytic properties [10, 11].
Several raw materials including bauxite [12] and nonbauxitic materials such as sillimanite, kaolin, and mica [13] which possess a high percentage of alumina have been successfully used as starting material in alumina synthesis. Although Bayer process has been widely employed in the synthesis of alumina using bauxite as a starting material, several researchers have successfully synthesized high purity alumina through the judicious application of materials such as nitrates, chloride, and sulphate as starting materials for alumina synthesis [11–14]. Available literature reveals that the synthesis of alumina is commonly carried out from synthetic chemical [13]. For instance [15, 16] produced alumina membrane from aluminium chloride via controlled precipitation technique while [15, 17, 18] synthesized alumina from the solution of aluminium oxy-hydroxide by precipitation method.
The high content of aluminium oxide  contained in kaolin as revealed by various x-ray fluorescence (XRF) results makes it an excellent source of raw material for γ-alumina production [19]. Several extraction methods have been employed to achieve high purity γ-alumina synthesis using kaolin as starting material. Such methods include a templating technique which involves an application of naturally occurring cellulosic materials [20], emulsion technique which entails calcination of starting materials [21–23] solution combustion synthesis [24] and pyrolysis processing [25]. Hence, there is need for the production of high quality alumina to be used as catalyst support for CNTs growth in a catalytic vapour deposition (CVD) technique.
Several materials have been applied as supports for catalyst synthesis for the growth of multiwall carbon nanotubes (MWCNTs) via thermally enhanced chemical vapour deposition (CVD) technique. Such support materials used during catalyst preparation include MgO,  ,
,  ,
,  , zeolite, and kaolin [1, 26]. Due to the high thermal dependence of materials suitable as catalyst support to grow MWCNTs, γ-alumina possesses admirable characteristics over most of the support materials. The synthesis, characterization, and application of γ-alumina as bimetallic catalyst support for the synthesis of MWCNTs in a CVD reactor is still very scanty in the open literature. The present study focuses on the synthesis of alumina as a catalyst support for CNTs growth. CNTs have been identified to strong inhibitory and antibacterial effects as well as a broad spectrum of antimicrobial activities. Also, carbon nanotubes possess the efficient biomedical application in the area of anti-fungi, anti-bacteria and excellent electrical properties [27]. The general applications of nanoparticles as an anti-bacterial agent have made their synthesis importance in the field of nanomaterial production. For instance, the effectiveness of antibacterial activity against scurf or acne has been reported to possess no tolerance to anti-biotic found in cosmetic industries and commercial usage of soap which aid their application as a disinfectant [28, 29].
In this study γ-alumina was synthesised using the leaching-precipitation technique of locally sourced kaolin. The γ-alumina was then employed as bimetallic catalyst support for the synthesis of MWCNTs in CVD equipment. The antibacterial activities of the catalyst, as-synthesized MWCNTs, and purified MWCNTs were investigated on selected micro-organisms. The synthesized γ-alumina, bimetallic catalyst, and the MWCNTs were characterized using thermogravimetric analysis (TGA), high-resolution scanning electron microscopy (HRSEM), energy dispersive x-ray spectroscopy (EDX), x-ray diffraction (XRD), Fourier transform infrared spectroscopy (FTIR), transmission electron microscopy (TEM), x-ray fluorescene (XRF), Brunauer-Emmett-Teller (BET) specific surface area and particle sizer (nanosizer).
2. Experimental
2.1. Materials
Locally sourced kaolin from Lagos, Nigeria was used as a source of alumina in this study. Nickel nitrate hexahydrate ![$[{\rm Ni}{{({\rm N}{{{\rm O}}_{3}})}_{2}}\cdot 6{{{\rm H}}_{2}}{\rm O}]$](https://content.cld.iop.org/journals/2043-6262/9/3/035012/revision1/ansnaad5bbieqn026.gif) , iron nitrate nonahydrate
, iron nitrate nonahydrate ![$ [{\rm Fe(N}{{{\rm O}}_{3}}{{)}_{3}}\cdot 9{{{\rm H}}_{2}}{\rm O }] $](https://content.cld.iop.org/journals/2043-6262/9/3/035012/revision1/ansnaad5bbieqn027.gif) , concentrated tetraoxosulphate(VI) acid
, concentrated tetraoxosulphate(VI) acid  and methanol
  were supplied by Sigma Aldrich and used without further purification. All reagents were of analytical grade with percentage purity of 95%–99.99%. Acetylene and argon gases were supplied by BOC Nigeria with percentage purity of 99.99%. The microorganism, E. coli, Klebsiella pneumoneae and Pseudomonas aeruginosa were obtained from Center for Genetic Engineering and Biotechnology (CGEB), Federal University of Technology, Minna, Niger state.
2.2. Synthesis of γ-alumina
A known weight (50 g) of as-received kaolin was calcined at  in a static air furnace for a period of 2 h to loosen the bonds in the material. About 12.5 g of metakaolin produced after the calcination process was added to 250 ml of 2 N tetraoxosulphate(VI) acids. The resulting mixture was then stirred overnight at
  . The mixture was allowed to settle then filtered; the filtrate and the residue were collected separately. About 5 ml min−1 of the clear-filtrate was introduced into 500 ml methanol contained in a beaker under continuous stirring at
  with the aid of a magnetic stirrer and hot plate until a gelatinous precipitate which later crystalized was obtained. The precipitate was washed with distilled water, dried at
  for 12 h then calcined at
  for 2 h to produce γ-alumina. The synthesized γ-alumina was then characterized using TGA, BET, HRSEM/EDX, XRD, and FTIR.
2.3. Preparation of Fe-Ni/γ-alumina catalyst
The synthesized γ-alumina was employed as a support material for the preparation of the bimetallic catalyst. Modified-wet impregnation method was employed for the deposition of the active phase of catalyst on the support material. The equal weight percentage of Fe and Ni salts were used in the preparation of the catalyst. 4.16 wt% of Fe and 6.08% of Ni salts were dissolved in a beaker containing 25 ml of distilled water. The resulting solution was stirred to the ensured total dissolution of the salts in a water medium. The obtained solution was added to 5.00 g of γ-alumina support and the resulting mixture was transferred to a magnetic stirrer and hot plate operated at a temperature of  for 4 h. The resulting slurry was dried, grinded and sieved through
  sieve size. The obtained dried particles were transferred to a muffle furnace and calcined at a temperature of
  for 3 h. The calcined catalyst was allowed to cool then transferred into a sample bottle for further use. The resulting catalyst was analysed to determine the thermal stability, surface area, surface morphology, crystallinity, and surface functional group.
2.4. Synthesis of carbon nanotubes
Carbon nanotubes (CNTs) were synthesized by a chemical vapour deposition (CVD) equipment that is made of cylindrical tube reactor of length 1010 mm with external and internal diameters of 60 and 52 respectively (figure 1). About 1.0 g of the prepared bimetallic catalyst (Fe-Ni/γ-alumina) was weighed and spread uniformly inside a reaction boat which was placed at the centre of the cylindrical tube. The temperature, heating rate, and gas flow rate were automatically controlled to the desired levels. The quartz cylindrical tube was purged with argon gas at a flow rate of  and a heating rate of
  . The argon flow rate was increased to
  at a reaction temperature of
  while the carbon source (acetylene) was introduced at a flow rate of
  for 40 min. The acetylene gas flow was stopped immediately the reaction time elapsed and the flow rate of argon gas was reduced to
  while the equipment was allowed to cool to the room temperature. The boat containing the deposited carbon material was removed and weighed to determine the percentage of carbon yield during the process. The deposited carbon was analysed for surface area, functional group, thermal analysis, crystallinity, particle size, surface morphology, internal morphology and elemental analysis.

Figure 1. Schematic presentation of a CVD setup.
Download figure:
Standard image High-resolution image2.5. Purification of the as-synthesized carbon nanotubes
The as-produced CNT sample was purified using 30% volume of concentrated nitric acid and stirred for 30 min using a magnetic stirrer at room temperature to remove the residual catalysts. Thereafter, the sample was washed with distilled water until pH 7.0 was achieved and later dried at  for 8 h.
The bi-metallic catalysts, as-produced and purified MWCNTs were characterized via series of characterization techniques. Such techniques include the thermal analysis by thermogravimetric analyser (TGA 4000) by PerkinElmer, the surface morphology and elemental analysis (HRSEM/EDX) by Zeiss Auriga, crystallinity by XRD (Bruker AXS D8), specific surface area, pore size and pore volume by BET method (Nova 4200e), surface functional group using FTIR (Frontier FT-IR model), particle size analysis by dynamic light scattering (DLS) method (Zetasizer Nano-S by Malvern), and by TEM (Tecnai G2 F20-Twin) and compositional analysis (PW2400 XRF) by Philips.
2.6. Antimicrobial assay
To prepare the nutrient agar, 28 g of the nutrient agar was dissolved in one litter sterile distilled water and then autoclaved at  for 15 min. Then the nutrient broth was prepared by dissolving four gram of the nutrient agar dissolved in 300 ml of sterile distilled water and 10 ml of nutrient broth was dispensed in three test tubes for each organism. This was then autoclaved at
  for 15 min. The deionized water to be used was also sterilized in an autoclave at
  for 15 min. After sterilization they were allowed to cool to about
  and the nutrient agar was then dispensed into petri dishes which were left to solidify. The organisms were then inoculated into the nutrient agar plate, and then 1 mg of each of the dispersed nanomaterials was dispensed. The petri dishes were left to stand for 2 h and then placed in the incubator for 24 h. After incubation the microbial were count to determine the degree of organism growth.
3. Results and discussion
The choice of γ-alumina in most area of application has made its synthesis a more important and interesting aspect of material development. In this study γ-alumina was synthesized from locally sourced kaolin. The choice of kaolin as the starting material is due to its availability and as naturally occurring material in every part of Nigeria. The surface morphology of the starting material (kaolin) was examined using high resolution scanning electron microscopy (HRSEM) and its elemental analysis by EDX as shown in figures 2(a) and (b), respectively.
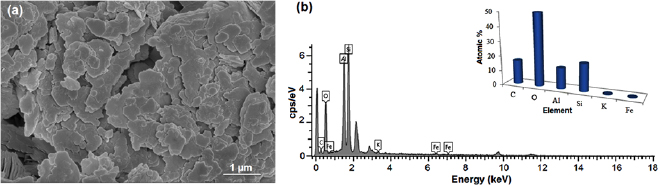
Figure 2. (a) HRSEM micrograph of kaolin sample, and (b) corresponding EDX spectrum and atomic percentage.
Download figure:
Standard image High-resolution imageThe micrograph depicts plate-like nature of kaolin with irregular particle shapes which contain compartments of an aluminosilicate ![$ [{\rm A}{{{\rm l}}_{2}}{\rm (S}{{{\rm i}}_{2}}{{{\rm O}}_{7}}{\rm)(OH}{{{\rm)}}_{4}}]$](https://content.cld.iop.org/journals/2043-6262/9/3/035012/revision1/ansnaad5bbieqn058.gif) constituent which is the dominant component of kaolin. The depicted structure might be related to the strong interaction bond which exists in aluminosilicate material. The EDX revealed the presence of C, O, Al, Si, K and Fe with percentage weight of 16.35, 49.95, 14.25, 18.83, 0.32 and 0.3%, respectively. The presence of higher percentage weight of oxygen can be traced to the presence of oxides of the elements in the kaolin sample. Meanwhile, the carbon content is attributed to the presence of organic constituents due to the source of the kaolin and the carbon grid used during the scanning electron microscopy analysis. Evidently from the EDX (figure 2(b)), the dominantly identified elements are aluminium and silicon. Therefore there is high tendency to adopt a defined mechanism for the leaching of aluminium oxide from the bulk material of metakaolin using ethanol as solvent.
constituent which is the dominant component of kaolin. The depicted structure might be related to the strong interaction bond which exists in aluminosilicate material. The EDX revealed the presence of C, O, Al, Si, K and Fe with percentage weight of 16.35, 49.95, 14.25, 18.83, 0.32 and 0.3%, respectively. The presence of higher percentage weight of oxygen can be traced to the presence of oxides of the elements in the kaolin sample. Meanwhile, the carbon content is attributed to the presence of organic constituents due to the source of the kaolin and the carbon grid used during the scanning electron microscopy analysis. Evidently from the EDX (figure 2(b)), the dominantly identified elements are aluminium and silicon. Therefore there is high tendency to adopt a defined mechanism for the leaching of aluminium oxide from the bulk material of metakaolin using ethanol as solvent.
The oxide compositional analysis of the kaolin sample was carried out using x-ray fluorescence (XRF) technique (figure 3). In the XRF analysis shown in figure 3, the chemical compositions of elements present in the kaolin sample and their corresponding percentage contributions were recorded with major and minor elements present; all expressed in the form of oxides. The result presented in figure 3 shows the presence of  , MnO,
  , CaO,
  ,
,  ,
,  , MgO, with percentage composition of 0.73, 0.02, 0.26, 0.19, 1.26, 52.27, 33.80, 0.11, respectively, in the kaolin sample with percentage loss on ignition (LOI) of 11.44%. It is obvious from the compositional analysis result of the kaolin sample that the sample contains a high content level of
  . Silicon(IV) oxide has been reported to constitute the highest percentage of kaolinite sample [22]. In the same vein, aluminium oxide with percentage composition of 33.80% was identified to be the second most populous constituents in the kaolin sample. The ratio of alumina-silica was estimated to be 1:1.5. This result is in close agreement with the findings of Edomwonyi-Out et al [19]. This is an indication of the presence of alumina with reasonable quantity for leaching process from the kaolinite sample. Meanwhile, MnO has the lowest percentage composition in the kaolin sample which may be attributed to the geographical and environmental contribution of the earth crust where the sample was mined. The percentage loss on ignition (LOI) was determined to be 11.44% which indicates the loss of volatile and organic contents of the raw kaolin sample.
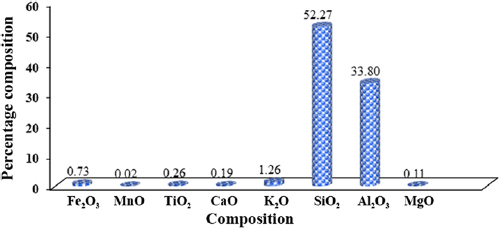
Figure 3. Compositional analysis of kaolin.
Download figure:
Standard image High-resolution imageThe surface area, pore volume and pore size of the kaolin was determined using BET technique. The BET surface area of a material is physical adsorption (physiosorption) of a fluid material on the solid surface and the quantity of adsorbate which is equivalent to the monolayer volume of the surface. The BET surface area summary is shown in table 1.
Table 1. Summary of BET results of kaolin.
Surface area  |
Specific surface area  |
Pore volume  |
Pore size  |
|---|---|---|---|
| 461.70 | 106.19 | 8.857e-02 | 31.02 |
The surface area and specific surface area of the kaolin sample were obtained by the evaluation of the multilayer adsorption of material in a nitrogen environment with relative consideration of the relative pressure of the analyser. The surface area and the specific surface area were determined to be  and
and  , respectively. The BET surface area of the kaolin sample is higher than
  that of Kankara kaolin reported by [15]. The variation and appreciation in the level of the surface area might be as a result of the post-mining treatment of the raw kaolin. The pore size and the pore volume were determined to be
  and
and  , respectively. These properties are relatively high compared to
  and
and  reported for the pore size and the pore volume of Kankara kaolin [15, 30]. For effective and efficient leaching process, the surface area, pore size, and pore volume are important parameters. Therefore, the kaolin used for this purpose has a very high tendency for effective leaching process. The functional group present in the kaolin sample was identified using Fourier transform infrared (FTIR) spectroscopy. The FTIR spectra of the raw kaolin sample are shown in figure 4. Generally, the regions of the spectra are divided into the functional group region
  and the finger-print region
  .
.
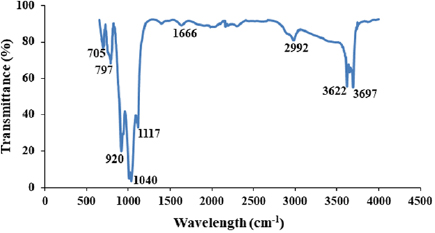
Figure 4. FTIR spectrum of raw kaolin.
Download figure:
Standard image High-resolution imageFrom figure 4, the band spectra at  regions correspond to the stretching of OH of the hydroxyl group in the kaolin sample. This is an indication of the presence of moisture content in the bulk of the kaolin sample. The band spectra at
  show the presence of interlayer OH of Al-O-H stretching. This finding is relatively close to some other reports elsewhere [31, 32]. At
  , the band frequency is related to the presence of C-H stretching group. The presence of the C-H stretching is a result of organic material presence in the kaolin sample due to the mining environment and the decomposed organic maters such as root and leaves of the plant. This observation has also been reported elsewhere [31, 33]. Furthermore, the frequency band at
  is assigned to H-O-H bending of water molecules in the kaolin sample. This is closer to the findings of [33] which reported
  but comparatively farther from the report of [31]. The variation in the band frequency may be as a result of treatment methods and processes in which the kaolin samples underwent in the various studies. At 1117 and 1040 cm−1, the band wavelength is associated with the plane stretching of Si-O normal. This is in close agreement with the report of [31]. In the same vein, the band wavelength at
  depicts the OH deformation, linked to
  . The band frequency at 797 and
  are linked to the presence of Si-O in the quartz bulk of the kaolin sample. Table 2 shows the band assignments of each functional group present in the kaolin sample.
Table 2. Bands assignments of FTIR spectra of kaolin sample.
Wavelength  |
Assignments |
|---|---|
| 3697 | OH stretching |
| 3622 | Al-O-H stretching of inner layer stretching |
| 2992 | C-H stretching |
| 1662 | H-O-H bending of water |
| 1117 | (Si-O) normal to the plane stretching |
| 1040 | (Si-O) planar stretching/clay minerals |
| 920 | OH deformation, linked to  |
| 797 | Si-O quartz |
| 705 | Si-O quartz |
The effect of temperature on the thermal stability of the kaolin sample was investigated and the result is shown in figure 5, which depicts the TGA/DTG plot of the kaolin sample with the weight loss against change in temperature between 30 °C to  . Region 'a' depicts the loss of hygroscopic water content of the kaolin, which means that the loss of hygroscopic water occurred between the temperatures of 30 °C to
  with an equivalent moisture content of 1.24%. Figure 5 obviously shows a narrow distribution of the gibbsite
  component at
  indicated as zone 'v' with percentage weight loss of 0.28%. This result is in close agreement with the report of [34]. The main weight loss was observed at zone b, which occurred at the peak temperature of
  with a corresponding weight loss of 12.61% which is assigned to the dehydroxylation of the kaolin sample. This is in close agreement with the findings in [35]. Hence, the onset temperature
  , the temperature at which the material starts degradation, was estimated to be
  with the degradation profile range between 278.66 °C to
  . The overall weight loss was estimated to be 15. 41% between the temperature range of 30 °C to
  . This further shows the high percentage content of clay minerals in the kaolinite sample. Therefore, the TGA/DTG of the kaolin aids in the identification of the composition of the kaolin sample and its thermal stability for possible sourcing of alumina.
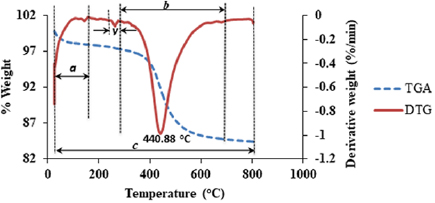
Figure 5. TGA/DTG plot of kaolin in nitrogen atmosphere.
Download figure:
Standard image High-resolution imageThe phase identification and the crystallinity of the kaolin sample were carried out using x-ray diffractometer (XRD) and the result is shown in figure 6. The crystallography of the kaolin sample shows numerous peaks at varied diffraction angles and intensities. Each diffraction angle represents a pristine phase of compound. Hence, the phase identification of the component compound in the kaolin sample was done. The XRD shows the presence of kaolinite, mica, and quartz. The major peaks were identified at the diffraction angle  of 8.9, 12.4, 19.9, 24.9, 26.6, 28.0, 35.0, 38.3, 50.1,
  with the corresponding component assigned as shown in figure 6. This phase angles identification is in agreement with the report of [36]. Therefore, the results of the various analyses conducted on the raw kaolin imply that the locally sourced raw kaolin has the potential for the production of γ-alumina which entails calcination of raw kaolin and leaching of aluminium oxide from the raw kaolin.

Figure 6. XRD spectrum of kaolin sample where M is mica, K is kaolinite and Q is quartz.
Download figure:
Standard image High-resolution imageIt can be inferred from various results of the analysis conducted on the raw kaolin that the kaolin is suitable for the gamma-alumina production. Equation (1) shows the chemical reaction of the calcination process of the bulk kaolin sample. The essence of the calcination process is to loosen the bonds which exist in the kaolin to produce an acid-soluble substance known as metakaolin.
The γ-alumina produced was characterised using HRSEM. The HRSEM result shows a low level of particle agglomeration and cubic nature of particles (figure 7) with nearly uniformly sized particles that were formed. The observed cubic structure revealed by HRSEM is in accordance with those reported by [1].
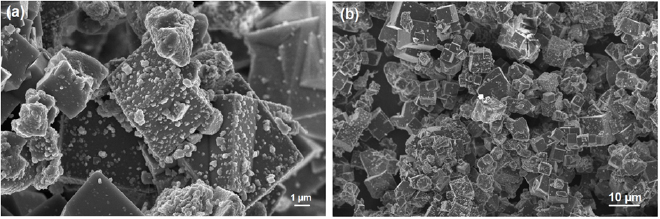
Figure 7. HRSEM micrograph of synthesized γ-alumina at different magnifications.
Download figure:
Standard image High-resolution imageThe elemental composition of the γ-alumina as shown in figure 8 was determined using EDX. Seven elements of various atomic percentages were observed while carbon has highest percentage. The highest percentage (42.05%) of carbon might be from the carbon grid on which the gamma-alumina was placed for SEM analysis. Meanwhile, 41.61% of oxygen possessed by the synthesized material is probably from the oxides of metals such as aluminium, silicon, sodium, titanium, iron, potassium, magnesium, and calcium.
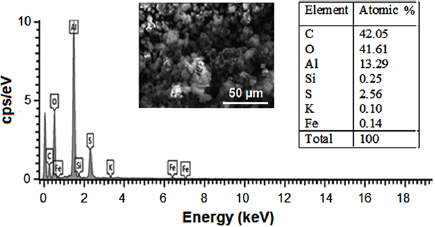
Figure 8. EDX spectrum of the synthesized γ-alumina.
Download figure:
Standard image High-resolution imageThe ratio of metallic aluminium to silicon is 53.16 with aluminium having the higher atomic percent. This percentage is an indication of the presence of many more alumina than silicon in the synthesized material. Furthermore, the lower energy level of oxygen, carbon, aluminium, iron and silicon were also obvious from the EDX spectrum. The reduction in the atomic weight percent of silicon in the synthesized γ-alumina compared to the raw kaolin is a direct indication of its oxide being retained during the leaching process due to its insolubility in tetraoxosulphate(VI) acid medium [37]. The summary of the EDX results of the kaolin and the gamma alumina were successfully compared to establish the effectiveness and the efficiency of the adopted solvent used during the extraction process. This summary is represented in figure 9.
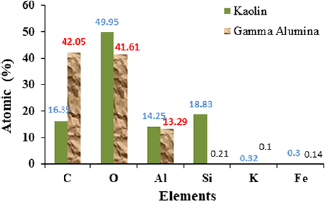
Figure 9. EDX summary of kaolin and the synthesized γ-alumina.
Download figure:
Standard image High-resolution imageThe efficiency of tetraoxosulphate(VI) acid as a leaching agent was quite obvious during the leaching process as shown in figure 9. The result indicates that there is a high affinity for the dissolution of metallic aluminium with little or no solubility of metallic silicon (figure 9). Hence, tetraoxosulphate(VI) acid is suitable to be used as a leaching agent for the synthesis of γ-alumina in the bulk of kaolin.
The surface area as determined by the BET method indicates that the surface area of the gamma alumina produced has been beneficiated with the novel method employed. The BET surface area of the γ-alumina is  (table 3) as compared to the starting kaolin material with
  . High surface area possessed by this material shows its possible application in catalysis and adsorption [8–10].
Table 3. Summary of BET results of γ-alumina.
Surface area  |
Specific surface area  |
Pore volume  |
Pore size  |
|---|---|---|---|
| 1023.17 | 306.98 | 0.102 | 22.02 |
The result presented in table 3 also indicates that the surface area, specific surface area, pore volume and pore size show appreciable increment compared to the starting kaolinite material. These properties appreciation can be attributed to the synthesis conditions and treatment methods employed during the production of the γ-alumina. The thermal stability of γ-alumina synthesized via precipitation in methanol medium is shown in figure 10.
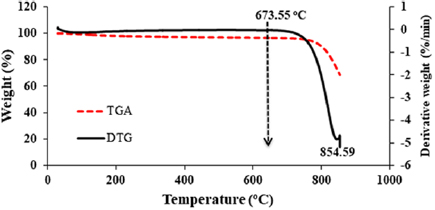
Figure 10. TGA/DTG plot of the synthesized γ-alumina.
Download figure:
Standard image High-resolution imageThe thermal analysis of the synthesized gamma alumina is shown in figure 10. The result depicts the weight response of synthesized γ-alumina to temperature changes. The derivative thermal and the thermogravimetric analyses are quantitative techniques for degradation monitoring and thermal behaviour of engineering material. From the temperature of 30 °C to  as shown in figure 10, there is no any observable change or loss in the material weight. The TGA/DTG of the γ-alumina shows high thermal stability with only one stage degradation at an elevated temperature of 673.55 °C and the peak degradation temperature of
  compared to the starting kaolinite material. From the obtained thermal properties, the synthesized γ-alumina can be applied in the area of catalysis; as catalyst support for the synthesis of carbon nanotubes. Figure 11 depicts the FTIR spectrum of γ-alumina showing the surface functional groups present in the sample.

Figure 11. FTIR spectrum of the synthesized γ-alumina.
Download figure:
Standard image High-resolution imageFrom figure 11, the peak which appears at  represents the tetrahedral nature of the aluminium ions in the synthesized gamma alumina. This peak is in accordance with the properties reported by [38] The physiosorbed water is represented by bands which appear in the region of 1241–
 . The peaks are quite reduced compared to those reported elsewhere [38, 39] This reduction in the number of appeared OH stretching band might be as a result of higher calcination temperature of
  employed in this study as contrary to
  used by [39]. Meanwhile, the broad OH stretching is represented by
  frequency.
The XRD spectrum of the synthesized γ-alumina is shown in figure 12. The XRD spectrum indicates that the produced gamma alumina is crystalline in nature due to the narrowness of the peak width. The peaks around  and
and  are a characteristic representation of γ-alumina phase [40, 41].

Figure 12. XRD spectrum of the synthesized γ-alumina.
Download figure:
Standard image High-resolution imageFigure 13 shows the compositional analysis (oxide composition) of the constituent element in the synthesized γ-alumina. The percentage composition of  ,
,  , CaO,
  ,
,  ,
,  and MgO were 0.87, 0.23, 0.27, 0.60, 14.79, 43.60 and 0.14%, respectively. It was observed that the rate of alumina leaching exhibited by the leaching agent (tetraoxosulphate (VI) acid) is quite appreciable for the synthesis of γ-alumina. Silica
  and alumina
  are predominant oxides of the produced γ-alumina with
  having the highest percentage. In the same vein, the loss on ignition (LOI) was determined to successfully quantify the percentage of volatile materials in the form of degradability at elevated temperature to be 39.48%. This gives the percentage of volatile content of the synthesized γ-alumina. This is in agreement with the findings of [15].
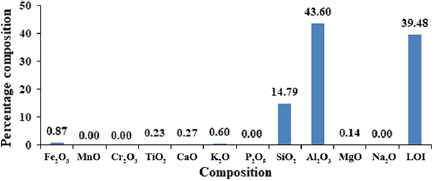
Figure 13. Compositional analysis of the synthesized γ-alumina.
Download figure:
Standard image High-resolution imageThe focus of this study was to utilize the γ-alumina synthesized as a catalyst support for MWCNTs growth. The synthesized bimetallic (Fe-Ni) catalyst on γ-alumina support was characterized to determine its crystallinity, morphology, elemental composition, surface area, thermal analysis and the nature of surface functional group present using XRD, SEM, EDX, BET, TGA and FTIR, respectively. The XRD spectrum of the developed Fe-Ni/γ-alumina is depicted in figure 14.

Figure 14. XRD spectrum of the developed Fe-Ni/γ-alumina.
Download figure:
Standard image High-resolution imageFigure 14 shows the XRD spectrum of Fe-Ni/γ-alumina which present the plot of the intensity as a function of the diffraction angle  in range of 10–80°. Basically, the formation of nickel ferrite
  was identified at the diffraction angles of 33.10 and
  . These peaks are a direct representation of the formation of the active oxide in the catalyst mix which is responsible for the nucleation process of carbon nanotubes formation. The peaks at
  of 21.12, 30.11 and
  represent the presence of crystal phase of γ-alumina while the occurrence of γ-alumina was also identified at the diffraction angle of 49.12 and
  and NiO was identified at the diffraction angle of 39.78 and
  . The crystallite particle size was then calculated from the XRD data using Scherer equation:
where  is the particle size diameter,
  is the full width at half maximum,
  is the wavelength of x-ray (0.1541 nm) and
  is the diffraction angle and
  is the Scherer constant (0.94).
Figure 15 shows the distribution of different nanoparticle sizes in the Fe-Ni/γ-alumina catalyst.
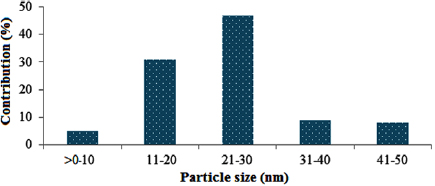
Figure 15. Particle size distribution of the developed Fe-Ni/γ-alumina catalyst.
Download figure:
Standard image High-resolution imageThe average crystalline particle size was then estimated to be 26.23 nm. This is another indication that this catalyst can actually be employed to produce CNTs in a CVD reactor. Furthermore, to effectively determine the surface functional group present in the developed catalyst, the catalyst was characterised using Fourier transform infrared spectroscopy and the result is presented in figure 16.
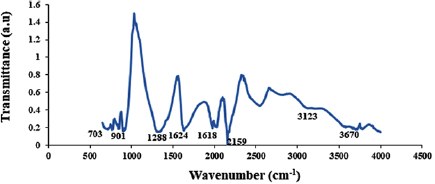
Figure 16. FTIR spectrum of the developed Fe-Ni/γ-alumina.
Download figure:
Standard image High-resolution imageThe presence of water molecule is evident with the presence of wave number at  . This peak
  represents the presence of O-H which might be attributed to the adsorbed water molecule after the calcination process. The hygroscopic nature of the calcined bimetallic catalyst (Fe-Ni/γ-alumina) may be due to inherited characteristics of the starting nitrates used during the process of catalyst synthesis. Furthermore, the observed peaks around 1624 and
  are associated to the presence of nickel ferrite nanocrystals while the ferrite stretching vibration was observed at
  . This finding is in close agreement with the report of [42]. Also, the wavelength identified around 1288 cm−1 corresponds to
  bending and stretching mode. The presence of NO2 bending and stretching mode can be attributed to
  in the three salts used to prepare the catalyst. The identified peaks are summarily presented in table 4.
Table 4. Functional group assignment of observed wavelength.
Wavelength  |
Assigned group |
|---|---|
| 3123, 3670 | Water molecules (O-H) |
| 1624, 1618, 901, 703 | Ferrite stretching vibration |
| 1288 | NO2 bending and stretching mode |
The surface microscopic feature of the developed nickel ferrite catalyst was examined using the high resolution scanning electron microscope (HRSEM). The microscopic structure of the developed bimetallic catalyst is shown in figure 17.
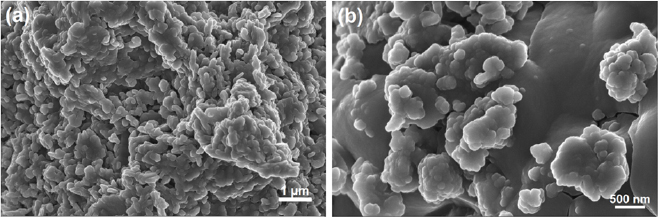
Figure 17. HRSEM images of the developed Fe-Ni/γ-alumina catalyst at different magnifications.
Download figure:
Standard image High-resolution imageFrom figure 17, the detailed micrograph of the catalyst sample is revealed. The HRSEM shows the microscopic image of the catalyst sample in a wide range of size distributions with particle sizes of nearly tetrahedral crystals. This crystal shape is further illustrated with the white circles in figure 17. Furthermore, the white circle also represent the nickel ferrite  compound obtained from the calcination process of the catalyst material; the most participating component of the catalyst material during the CNTs nucleation process in the CVD reactor. The surface area, micropore volume and micropore half pore width of the bimetallic catalyst developed was determined under nitrogen atmosphere to be
  ,
,  and of
  , respectively. The possession of large surface area of this catalyst compared to 285.62 m2 g−1 reported by [26] is an indication of its efficiency for improved catalytic cracking of acetylene in the CVD equipment.
The elemental composition of the catalyst material was identified and quantified in terms of the atomic percentage in the catalyst mix. The energy dispersive x-ray spectroscopy (EDX) was employed for this elemental analysis and the results are shown in figure 18.

Figure 18. EDX spectrum (a) and summary (b) of the Fe-Ni/γ-alumina catalyst.
Download figure:
Standard image High-resolution imageFigure 18 depicts the presence of C, O, Fe, Ni, Si and Al observed at the lower energy levels. Meanwhile, the atomic percentage of C, O, Al, Si, S, Fe and Ni were determined to be 48.22, 39.05, 4.97, 0.09, 3.12, 1.41 and 2.42, respectively. The presence of higher percentage weight of oxygen was due to the presence of oxides of the elements in the catalyst sample. The presence of oxygen-doped-catalyst was as a result of the calcination process of catalyst synthesis which occurred in a furnace in the presence of air, where oxygen was introduced.
Based on the various analyses conducted on the prepared catalyst, it could be inferred that the catalyst will be suitable for the growth of CNTs. In order to validate this claim, the prepared and well characterized bimetallic catalyst (Fe-Ni/γ-alumina) was charged into the horizontal CVD reactor for the synthesis of multiwalled carbon nanotubes (MWCNTs).
The effect of reaction time on the yield of the carbon nanotubes was further established to determine the maximum time which favours the production of high yield of MWCNTs. Figure 19 shows the response of yield to the changes in reaction time at constant temperature, flow rate of argon and acetylene in a CVD reactor.
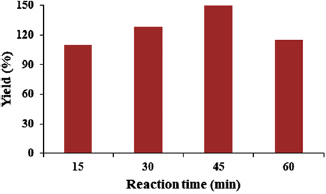
Figure 19. Effect of reaction time on the percentage yield of carbon nanotubes.
Download figure:
Standard image High-resolution imageIt's quite evident from the data presented in figure 19 that time has effect on the percentage growth of carbon nanotubes in a CVD reactor while all other parameters were kept constant. Considering the reaction time of 15 min, the percentage yield of the CNTs was 110%, this percentage yield increases to 128% at the reaction time of 30 min. The reason for this progressive increase in the percentage yield might be as a result of the presence of inactive catalyst particle whose efficiency was enhanced at a longer reaction time. This same behaviour has been observed in the report of [26] while studying the effect of reaction time on the yield of CNTs using Fe-Ni supported on alumina. The maximum time that favours the growth of high yield carbon nanotubes was observed at reaction time of 45 min. This indicates that the catalyst (Fe-Ni/γ-alumina) experiences a maximum residence time for its activities in terms of the adequate cracking on the acetylene, carbon source. Above this time, reaction time of 60 min, catalyst deactivation and the formation of an intermediates such as carbides might be formed which resulted to the lowering of CNTs yield from 150% to 115%. Therefore, for the production of optimum CNTs in a CVD reactor using Fe-Ni/γ-alumina catalyst, it's recommended to operate the CVD at a reaction time of 45 min.
The high yield synthesized CNTs was further analysed to determine its crystallinity, surface area, surface functional group, thermal analysis, morphology and elemental composition. Figure 20 shows the crystallographic nature of the MWCNTs produced and the average particle size was estimated using the Scherer equation (equation (2)).

Figure 20. XRD spectrum of the synthesized MWCNTs using Fe-Ni/γ-alumina.
Download figure:
Standard image High-resolution imageFigure 20 also shows the XRD spectrum of raw carbon nanotubes in the CVD reactor. The graphitized carbon phase of the MWCNTs is identified and represented with C at the diffraction angle of 2θ of 25.88 and 44.76°. The result also revealed the presence of trace compound of the catalyst material; nickel ferrite  was also observed at the refraction angles of 53.01 and
  . The average crystalline size of the produced carbon nanotubes was also determined to be 28.91 nm. This implies that the synthesized carbon nanotubes are of nanometre diameter as regards the crystalline size.
The FTIR spectrum in figure 21 was employed for the surface functional group identification on chemical substances. The peaks around 3288 and  are associated to the O-H while the band wavenumber at
  indicates the –OH vibrational bond that is out of the plane. The peaks at 1534 and
  represents the possible presence of C=C double bond resulting from incomplete decomposition of acetylene during the catalytic cracking of the gaseous hydrocarbon material. Furthermore, the presence of C-C bending was observed at 866 and
  . The thermal analysis of the synthesized MWCNTs at the growth condition of
  is presented in figure 22.
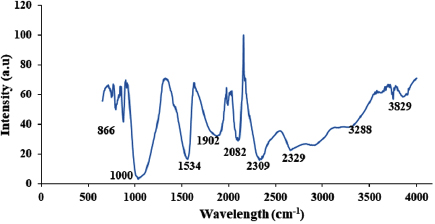
Figure 21. FTIR spectrum of the synthesized MWCNTs using Fe-Ni/γ-alumina.
Download figure:
Standard image High-resolution image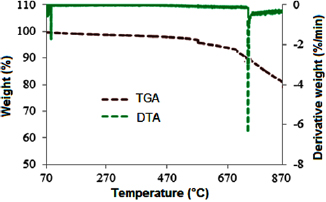
Figure 22. Thermal analysis of the as-synthesized MWCNTs.
Download figure:
Standard image High-resolution imageThe TGA/DTA result shown in figure 22 reveals the characteristic thermal behaviour of the synthesized MWCNTs. The TGA/DTA was used to determine the peak degradation temperature of the MWCNTs. It can be observed from the results presented in this Figure that the as-synthesized MWCNTs show no changes in weight as temperature increased from  to about
  . The peak degradation temperature of the MWCNTs as determined from the DTA was
  . This temperature shows high thermal stable materials with high tendency as possible application especially in the reinforcement of composites mix.
The EDX of the synthesized MWCNTs is presented in figure 23, which shows the elemental composition of the MWCNTs as well as the degree of graphitized carbon presence in the synthesized material which was revealed by the EDX analysis.

Figure 23. EDX spectrum (a) and summary of the synthesized MWCNTs using Fe-Ni/γ-alumina.
Download figure:
Standard image High-resolution imageThere are three identifiable elements in the MWCNTs synthesized which carbon (C), iron (Fe) and nickel (Ni) with the corresponding atomic percentage of 98.37, 0.8 and 0.83%, respectively, as shown in figure 23. It was observed that graphitized carbon has the highest percentage composition in the synthesized MWCNTs. This also is an indication of high purity level of the as-synthesized MWCNTs. Therefore, the percentage purity of the as-synthesized carbon nanotubes as evident from the EDX spectrum was 98.37%. Hence, for the synthesis of high purity MWCNTs, Fe-Ni catalyst on chemically prepared gamma-alumina plays a paramount role in a CVD reactor. The surface morphology of the as-synthesized MWCNTs was examined via the scanning electron microscope and the result is shown in figure 24.

Figure 24. SEM image of the as–synthesized MWCNT.
Download figure:
Standard image High-resolution imageThe image as presented in figure 24 shows that MWCNTs of varied diameters were produced during the graphitization of carbon in the CVD equipment. The varied diameters might be as a result of inconsistency in the catalyst diameters used for the synthesis. Also, carbon nanotubes possess long-strands of CNTs with branched tubes attached in both sides as indicated in red arrows.
In the same vein, the internal structural analysis of the as-synthesized MWCNTs was further examined via high resolution transmission electron microscope (HRTEM). The HRTEM images as presented in figures 25(a)–(f) show various micrographs of as-synthesized MWCNTs at different magnifications while the EDX spectral of the synthesized MWCNTs and selected area electron diffraction (SAED) of the synthesized MWCNTs were depicted in figure 26.
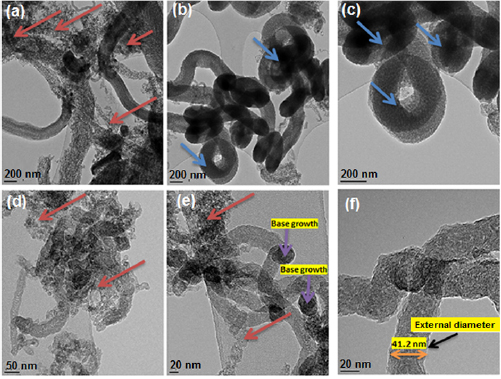
Figure 25. HRTEM images of MWCNTs (a−c) at different points but the same scale of 200nm, (d−f) at different points but the same scale of 20nm.
Download figure:
Standard image High-resolution image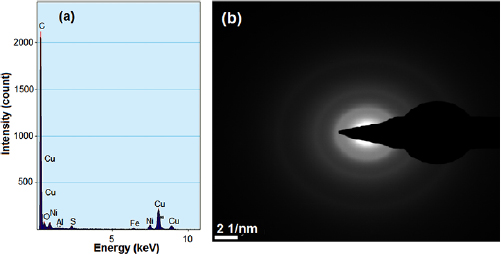
Figure 26. (a) EDX spectrum and (b) SAED of the synthesized MWCNTs.
Download figure:
Standard image High-resolution imageThe HRTEM of the nanomaterial (MWCNTs) shows a spongy-like shape characteristic properties (figures 25(b) and (c)) with dispersed nature of nanomaterial (figures 25(a), (d) and (e)). Furthermore, the HRTEM was employed in the estimation of the external diameter of the synthesized multiwall carbon nanotubes (MWCNTs). The external diameter was estimated to be 41.2 nm as depicted in figure 25(f).
Figures 26(a) and (b) depict the characteristics elemental composition and the SAED of the crystalline as-synthesized MWCNTs produced, respectively. The EDX spectra revealed the presence of the catalyst material that was retained after the MWCNTs growth in the CVD reactor while the presence of diffused nanomaterial in the as-synthesized MWCNTs was depicted with the concentric ring in the SAED result (figure 26(b)).
Carbon nanotubes are known to possess an interesting parameter called the aspect ratio; the ratio of the length to the diameter. In order to determine this parameter accordingly, a dynamics light scattering (DLS) technique was required to determine the hydrodynamic diameter  of the as-synthesis carbon nanotubes, diameter of an equivalent sphere. The diameter of as-synthesized MWCNTs estimated from the HRTEM micrograph was related to the
  (hydrodynamic diameter) using modified Navier-Stokes equation [26, 43] as shown following equation:
where  is the length,
  are the diameters of MWCNTs, and the ratio of
  represents the aspect ratio. The
  of the as-synthesized MWCNTs was found to be 2132 nm. Figure 27 depicts the result of the DLS-based correlation graph of the synthesized MWCNTs.
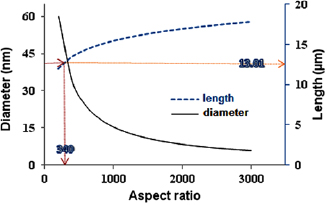
Figure 27. DLS-based correlation graph of the diameter and length of as-synthesized MWCNTs.
Download figure:
Standard image High-resolution image
The length and the aspect ratio of the as-synthesized MWCNTs were estimated to determine its possible area of application. The length was determined to be  with an aspect ratio of 340. This is a direct characteristic feature of a long tube MWCNTs. The result of the aspect ratio is in disagreement with the report of [26]. The variation in the aspect ratio may be due to the conditions of MWCNTs synthesis in terms of catalyst particle size, nature of support material, degree of crystallinity, and the CVD operating condition.
The surface area of the synthesized MWCNTs was determined using BET equipment. The surface area was determined to be  . The pore volume and the pore size were also found to be
  and 2.43 nm, respectively. The pore volume and the pore size of the synthesized MWCNTs suggest the area of the synthesized carbon nanotubes applications. The well characterized as-synthesized carbon nanotube was purified using acid purification process.
The effects of the as-synthesized MWCNTs purified MWCNTs and the prepared Fe-Ni/γ-alumina catalyst was investigated on the three prominent bacteria found in polluted water to ascertain their possible application in microbial removal and the results were presented in tables 5–7.
Table 5. Microbial counts at the 1st day of incubation process.
| Bacteria | Purified MWCNTs  |
Fe-Ni/γ-alumina  |
As-synthesized MWCNTs  |
|---|---|---|---|
| Escherichia coli |  |
 |
TNC |
| Klebsiella pneumoneae | TNC | NIL | TNC |
| Pseudomonas aeruginosa | TNC | NIL | TNC |
TNC is too numerous to count, cfu is colony forming unit
Table 6. Microbial counts at the 4th day of incubation process.
| Bacteria | Purified MWCNTs  |
Fe-Ni/γ-alumina  |
As-synthesized MWCNTs  |
|---|---|---|---|
| Escherichia coli | TNC | NIL | TNC |
| Klebsiella pneumoneae | TNC | NIL | NIL |
| Pseudomonas aeruginosa | TNC | NIL | TNC |
Table 7. Microbial counts at the 8th day of incubation process.
| Bacteria | Purified MWCNTs  |
Fe-Ni/γ-alumina  |
As-synthesized MWCNTs  |
|---|---|---|---|
| Escherichia coli | NIL | NIL | TNC |
| Klebsiella pneumoneae | NIL | NIL | NIL |
| Pseudomonas aeruginosa |  |
NIL |  |
The results of microbial effect presented in tables 5–7 reveal different inhibition characteristic properties of the purified MWCNTs, bimetallic catalyst and as–synthesized MWCNTs.
At the initial stage of incubation (table 1), the functionality of the purified MWCNTs and the as-synthesized MWCNTs on the three studied bacteria's shows no inhibition on the growth of the microbes on the nutrient agar. This shows that the microorganisms under review possess no antibacterial activities in the environmental condition posed by the purified and as-synthesized carbon nanotubes at day 1. Meanwhile, the bimetallic catalyst shows antibacterial activities in all the bacteria with no growth of organisms except in the E.coli with a countable number of organisms,  counts. Whereas, there is inhibition of all the microorganisms under study as regards to the bimetallic catalyst. The results of the inhibition of the bimetallic catalyst on the growth of the microbes indicate that the peptidoglycans component of the microbe's bacteria cell wall hydrolysed at a shorter period of time. This result is in accordance with the antimicrobial mechanism postulated by [44]. Also, the results presented in tables 5–7 show antimicrobial activity for purified MWCNTs increase as the exposure time increase. Therefore, this implies a time dependent activity.
4. Conclusions
In this study γ-alumina was synthesized using precipitation method in which methanol played a major role. The γ-alumina produced possessed high thermal stability with a peak temperature of  and cubic nature as revealed by the HRSEM micrograph. Furthermore, the prepared γ-alumina was found to be an excellent support for the preparation of bimetallic catalyst Fe-Ni/γ-alumina. The average crystalline particle size of the developed catalyst was then estimated to be 26.23 nm via Scherer equation. High thermal stable and high surface area MWCNTs was further synthesized in a horizontal CVD reactor at
  of argon flow,
  of acetylene flow for 40 min at the reaction temperature of
  using the bimetallic catalyst. The purified carbon nanotubes showed the high antibacterial effect on the tested microbial at long contact time while the inhibitions of the developed catalyst throughout the exposure were also high. Thus, the bimetallic catalyst prepared using the synthesis γ-alumina via precipitation method showed high efficiency in the synthesis of MWCNTs using chemical vapour deposition method.
Acknowledgment
The financial support from Tertiary Education Tax Fund (TETfund) Nigeria with grant number TETF/DESS/NRF/FUTM-20/6/ST1/Vol.1 is much appreciated. Support received for the use of facilities in Centre for Genetic Engineering and Biotechnology, CGEB, Federal University of Technology, Minna, Nigeria is also acknowledged.