

Abstract
Hydroxyapatite (HAp) co-doped by magnesium, strontium, sodium and fluorine was deposited on the 316L stainless steel (316LSS) substrates by electrodeposition method in electrolyte containing:  ,
,  ,
,  , NaF,
  and
and  . The influences of scanning potential ranges and temperature on MgSrFNaHAp coatings were researched. The obtained coatings under the optimum condition of scanning potential range from 0 to −1.7 V/SCE, at 50 °C have single phase crystals of HAp, cylinder shape and the thickness of 8.9 µm. The tests of 316LSS, NaHAp/316LSS and MgSrFNaHAp/316LSS materials in physiological saline and simulated body fluid (SBF) solutions were carried out. The results showed that the dissolution of MgSrFNaHAp coatings was lower than that of NaHAp ones and open circuit potential (OCP) of MgSrFNaHAp/316LSS was higher than those of NaHAp/316LSS and 316LSS at any immersion time. After 21 immersion days, the impedance modulus of MgSrFNaHAp/316LSS reached
  , which was 4.2 and 1.7 times higher than those of 316LSS and NaHAp/316LSS, respectively. The corrosion current density
  of MgSrFNaHAp/316LSS decreased about 2.3 and 7.8 times in comparison with that of NaHAp/316LSS and 316LSS, respectively. These results indicated that MgSrFNaHAp coatings can protect for the 316LSS substrates better than NaHAp coatings.
Export citation and abstract BibTeX RIS

Original content from this work may be used under the terms of the Creative Commons Attribution 3.0 licence. Any further distribution of this work must maintain attribution to the author(s) and the title of the work, journal citation and DOI.
1. Introduction
316L stainless steel (316LSS) was widely used in many fields, particularly in orthopedics and dental implants because in the biological environment it has the high corrosion resistance ability and good biocompatibility. However, when 316LSS was implanted in the body, in some cases the tissues could not be developed on the surface of its, so it is not easy to form chemical bonds with natural bone [1]. In addition, 316LSS could be corroded when it was immersed too long in the physiological environment and the corrosion products could be harmful to the body [2]. Therefore, to improve these problems, 316LSS was generally coated by biomaterials such as hydroxyapatite  .
.
Hydroxyapatite (HAp) has chemical composition similar to the inorganic composition in natural bone and has excellent biological activity so it should be applied in medical implant field [3, 4]. HAp could stimulate the bonding between the implant materials and host bone leading to faster bone healing ability [5–7]. Moreover, HAp coatings also defend for substrates against corrosion. However, existing long time in the physiological environment, HAp coatings could be dissolved and affect the implant fixation [2, 8, 9]. Therefore, it is necessary to improve the solubility of HAp coatings by doped some trace elements ions present in the inorganic of natural bones such as  ... [10, 11].
The presence of sodium in HAp has an important role in enhancing metabolism and stimulating bone cells growth [12, 13]. In comparison with pure HAp coatings, NaHAp coatings have stronger bonding strength and higher Young's modulus [14]. Magnesium is also known to be one of the most important elements in all skeletal metabolism stages and bone tissue formation [2, 15–18]. Strontium is an essential trace element for the human body with a special role in promoting osteoblast growth and inhibiting bone resorption [9, 19–21]. However, the effect of strontium on bone metabolism depends on its concentration. With low concentrations, strontium increases the replication of preosteoblastic cells and the bone metabolism, stimulates bone growth. In contrast, with high concentrations strontium causes bone mineralization defect [22, 23]. Fluorine is present in the natural bone and tooth tissue with the important role to improve crystallization and mineralization of calcium phosphate for new bone formation [24]. In comparison with pure HAp coatings, FHAp coatings with a small amount of fluorine could be the lower dissolution, better mechanical properties and comparable or better biocompatibility [9, 25].
The trace elements ions are able to incorporated into HAp structure by many method such as: plasma [6], electrodeposition (ED) [9, 25, 26], sputter [19], pulsed-laser [20, 21]... Among them, ED is considered an important technology because it is a simple, highly effective method and the obtained HAp coatings has the high purity and bonding strength.
This paper studied co-doping essential ions ( and
and  ) existed in natural bone into HAp coatings by ED methods. The obtained MgSrFNaHAp coatings were investigated and in vitro tested in SBF solution and in 0.9% NaCl solution.
2. Experimental
2.1. Materials
The working electrode is 316LSS sheet with size and component as in our previous paper [26]. Before used in electrochemical cell, the sutface of 316LSS was treated and limited at  of working area.
2.2. Electrodepositon of MgSrFNaHAp coatings
NaHAp and doped HAp coatings were synthesized on the 316LSS by cathodic scanning potential method in 80 ml solution containing Ca2+,  and some other ions with different concentrations. The solutions were denoted as following:
- Solution SNa consists
 ,
, - Solution SF consists,
- Solution SSr consists,
- Solution SMg consists,
- Solution SMgSrFNa consists .


MgSrFNaHAp coatings were synthesized under following conditions: the different scanning potential ranges are from 0 to −1.5, 0 to −1.7, 0 to −1.9 and 0 to −2.1 V/SCE; the reaction temperatures are 25, 35, 50, 60 and 70 °C.
The electrodeposition was carried out in three-electrode cell in which 316LSS is a working electrode, platinum foil is a counter electrode and saturated calomel electrode (SCE) is the reference electrode.
2.3. Coatings characterization
Precise analytical balance (XR 205SM-PR, Swiss) was used to determine the mass of MgSrFNaHAp coatings deposited on the surface of 316LSS (the mass change of 316L SS samples before and after synthesis process). Alpha-step IQ system (KLA-Tencor, USA) was employed to measure the thickness of the coatings following the standard of ISO 4288-1998. The automatic adhesion tester (PosiTest AT-A, DeFelsko) employed to adhesion strength of the coatings on 316LSS substrate according to ASTM D-4541 standard [27].The charge of synthesis process was determined by taking the integral from the start to the end point of the cathodic polarization curve.
Hitachi S4800 (Japan) scanning electron microscopy (SEM) was using to detect the surface of the sample. JSM 6490-JED 1300 Jeol (Japan) energy-dispersive x-ray spectroscopy (EDS) was used to identify the composition of elements in MgSrFNaHAp coatings. Siemens D5005 x-ray diffraction (XRD) was employed for phase identification. From XRD pattern, the crystallite size of obtained coatings was calculated from (0 0 2) reflection, using Scherrer's equation [26], and the lattice parameters  were calculated from peak (0 0 2) and (2 1 1), using the following equation:
where,  is determined from XRD, which is the distance between adjacent planes in the set of Miller indices
  [28].
[28].
2.4. Dissolution test
Physiological saline solution (0.9% NaCl, pH of 7.4, temperature of 37 °C) was used to examine the dissolution behavior of MgSrFNaHAp coatings. After immersion in this solution at different times (from 2 days to 14 days), the samples of MgSrFNaHAp/316LSS were taken out and the obtained solution was used to measure the concentration of  dissolved from the coatings by using atomic absorption spectrometric method on Perkin-Elmer 3300 equipment.
2.5. Preparation of the simulated body fluid (SBF) and vitro test
The SBF solution is prepared according to the list of chemical composition which shown in table 1 [28].
Table 1. Chemical composition of the SBF solution [28].
| Compound | Content ( ) ) |
|---|---|
| NaCl | 8.00 |
| KCl | 0.40 |
 |
0.18 |
 |
0.35 |
 |
0.48 |
 |
0.10 |
 |
0.06 |
 |
0.10 |
| Glucose | 1.00 |
316LSS or NaHAp/316LSS or MgSrFNaHAp/316LSS samples were immersed in 80 ml of SBF solution and during immersion times the temperature was maintained at 37 °C ± 1 °C by incubating the system in water bath.
The open circuit potential (OCP), electrochemical impedance spectra (EIS) and pH of the solutions were measured versus different immersion times. EIS studies were carried out at OCP in the frequency range of 100 kHz to 10 mHz with an amplitude of 10 mV. The polarization curves of samples were obtained in the potential range from −0.5 to +0.5 V/SCE compared with the OCP at a scan rate of  for detection of corrosion parameters and the effective protection for the substrates according to the following equation
where  is the effective protection (%),
  and
and  are the corrosion current density of 316LSS uncoated and coated HAp dope, respectively.
The concentration of released iron from 316LSS substrates into the SBF solution during the immersion test was measured by AAS method on Perkin-Elmer 3300 equipment.
3. Results and discussion
3.1. Effect of the scanning potential range
The cathodic polarization curve of 316LSS substrates in SNa, SMg, SF, SSr and SMgSrFNa solutions are shown in figure 1. The  or NaF or
  is added to SNa solution leading to improve the ionic strength of the electrolyte and increase the reduction speed of
  to
to  so the current density increased. In the SSr, SMg and SF solutions with the addition of
  ,
,  , and NaF, respectively, the current density increases in compare with SNa solution. Thus, in the SMgSrFNa with the present all of
  , NaF and
  , the current density increases quickly and the reaction of forming MgSrFNaHAp occurs more easily.
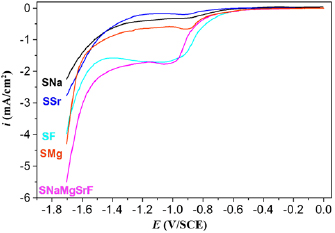
Figure 1. The cathodic polarization curve of 316LSS substrates at 50 °C, scanning rate  in SNa, SSr, SF, SMg and SMgSrFNa solution.
Download figure:
Standard image High-resolution imageThe values of the current density are nearly unchanged and approximately zero at the potential range from 0 to −0.6 V/SCE because no reaction occurs on 316LSS substrates. In the potential from −0.6 to −1.2 V/SCE, the reduction of  to produce
  occurs leading to the current density increased slightly [25].
With negative potential of −1.2 V/SCE, several electrochemical reactions occur (the reduction of  ,
,  and
and  to produce
  ,
,  and
and  ) so the current density increases strongly [18, 25]. Hydroxide is generated on the cathode surface to lead the formation
  ions by acid-base reaction of
  and
and  [18, 25, 26]. Then
  ions reacted with
  and
and  ions to form MgSrFNaHAp coatings on the cathode substrates as follows
Figure 2 presents the XRD patterns of MgSrFNaHAp coatings deposited at different potential ranges. All recorded peaks could be ascribed to HAp phase and the substrates. The characteristic peaks of HAp phase were at  (0 0 2), 32° (2 1 1), 33° (3 0 0), 46° (2 2 2) and 54° (0 0 4). Characteristic peaks of the substrates are observed at
  (Fe) and
  , 51° (CrO.19FeO.7NiO).
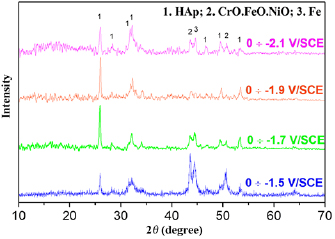
Figure 2. XRD patterns of MgSrFNaHAp/316LSS synthesized at the different potential ranges.
Download figure:
Standard image High-resolution imageThe SEM images showed that morphology of MgSrFNaHAp coatings changed when the scanning potential range varied (figure 3). MgSrFNaHAp coatings synthesized at 0 to −1.5 V/SCE had the spherical shapes (figure 3(a)); from 0 to −1.7 V/SCE, the obtained coatings were uniform and had rod shapes with average size about  (figure 3(b)). With the more negative potential, MgSrFNaHAp coatings were not uniform, but they had rod shapes (figure 3(c)). In addition, the effect of the potential range on the mass and thickness of the obtained coatings was reported in our previous paper. It is clearly that the potential range of 0 to −1.7 V/SCE, the mass and thickness of MgSrFNaHAp coatings reach the maximum value (3.15 mg × cm−2 and 8.9 µm) [26].
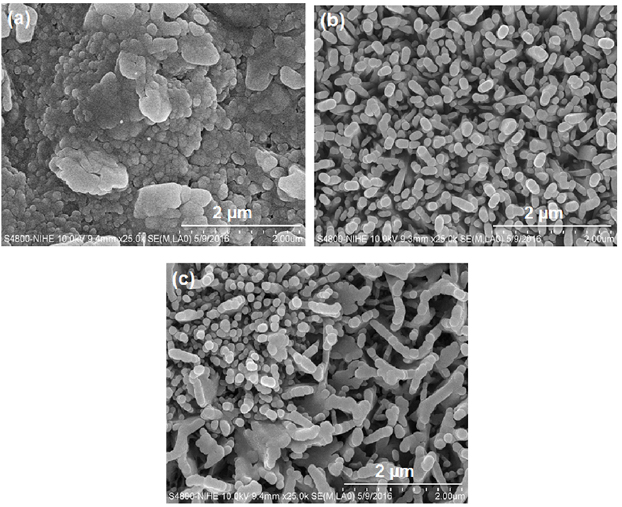
Figure 3. SEM images of MgSrFNaHAp/316LSS coatings synthesized at different potential ranges: (a) 0 to −1.5, (b) 0 to −1.7, and (c) 0 to −1.9 V/SCE.
Download figure:
Standard image High-resolution imageFrom these results above, the scanning potential range from 0 to −1.7 V/SCE is chosen to deposit MgSrFNaHAp/316LSS.
3.2. Effect of electrodeposition temperature
The influence of temperature on the deposition of MgSrFNaHAp coatings is studied at the range from 25 °C to 70 °C in the SMgSrFNa solution. With the change of temperature, the charge, mass, thickness and adhesion of MgSrFNaHAp coatings obtained are shown in table 2. With the temperature increases from 25 °C to 70 °C, the charge of the synthesis process increases from 0.41 to 4.27 C, respectively. The mass and the thickness increase when the electrodeposition temperature increases from 25 °C to 50 °C and reaches a maximum value at 50 °C ( and
and  ). At the higher temperatures (60 °C and 70 °C), these values decrease. The results are explained by the growth temperature leading to the increase of the charge, generation of larger amounts of
  and
and  ions which diffuse into the solution to form MgSrFNaHAp powder.
Table 2. The variation of charge, mass, thickness, and adhesion strength of obtained coatings at the different temperatures.
 |
Charge (C) | Mass  |
Thickness  |
Adhesion (MPa) |
|---|---|---|---|---|
| 25 | 0.41 | 1.16 | 3.90 | 14.8 |
| 35 | 1.79 | 2.13 | 7.10 | 8.60 |
| 50 | 3.89 | 3.17 | 9.00 | 8.38 |
| 60 | 4.13 | 1.94 | 6.20 | 8.02 |
| 70 | 4.27 | 1.25 | 3.50 | 7.47 |
When the electrodeposition temperature increases, the adhension between MgSrFNaHAp coatings and 316LSS substrates decreases. It can be explained that the rise of the temperature can promote the reduction of  to generate
  gas on the surface of 316LSS leading to the obtained coatings is porous.
The obtained XRD patterns are shown in figure 4. The typical peaks of the substrates 316LSS were observed at  (Fe), and
  and
and  (CrO·19FeO·7NiO) in all samples. At 25 °C, the obtained coatings is mostly dicalcium phosphate dehydrate
  with the typical peaks at
  and
and  . DCPD is formed due to the reaction between
  and
and  :
:

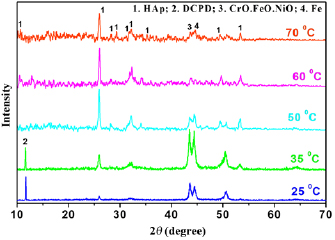
Figure 4. XRD patterns of MgSrFNaHAp/316LSS synthesized at the different temperatures.
Download figure:
Standard image High-resolution imageWith the temperature rising to  , the result indicated that the obtained coatings are composed of DCPD and HAp phase. The typical peaks of HAp are observed at
  (0 0 2),
  (2 1 1),
  (3 0 0),
  (2 2 2) and
  (0 0 4). With temperature from
  , the peaks of DCPD are not detected and there are only peaks of HAp phase. This result is explained that the temperature affects the reaction rates creating
  . Because the temperature rises, the reaction rate increases and the amount of OH− ions generate to transform
  into
into  completely, so the obtained coatings is single-phase of HAp. Therefore, the temperature at 50 °C is chosen to prepare MgSrFNaHAp coatings on 316LSS.
3.3. The characterizations of MgSrFNaHAp coatings
The obtained MgSrFNaHAp coatings at 50 °C, from 0 to −1.7 V/SCE and 5 scanning times in SMgSrFNa solutions are characterised by EDX, XRD and SEM.
The result shows the presence of seven main elements in the component of MgSrFNaHAp containing 32.65% Ca; 49.34% O; 15.76% P; 0.14% Mg; 0.58% Na; 1.50% F and 0.03% Sr (figure 5) [26]. It means that Mg, Sr, F, Na had been successfully co-doped into the coatings with the suitable element component in natural bone. Thus, these materials have high biocompatibility and promoted the formation of a new bone rapidly after implantation [2, 9].
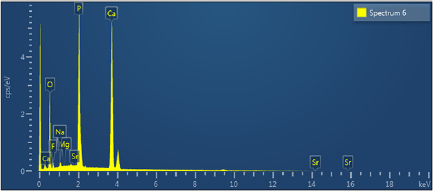
Figure 5. The EDX spectra of MgSrFNaHAp coatings synthesized.
Download figure:
Standard image High-resolution imageThe XRD patterns of NaHAp and MgSrFNaHAp coatings synthesized in the same condition exhibit the HAp phase (figure 6). The characteristic peaks are found at  about 32° (2 1 1) and 26° (0 0 2). This result shows that MgSrFNaHAp coatings are crystals and a single phase of HAp. Moreover, the higher intensity of the (0 0 2) plane of the MgSrFNaHAp coatings compared with that of NaHAp ones may be explained by the crystal lattice distortion caused by
  and
and  incorporation [9].
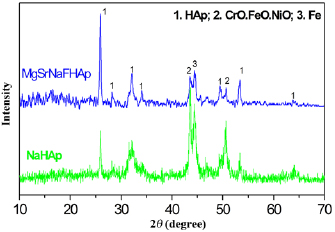
Figure 6. XRD patterns of NaHAp and MgSrFNaHAp/316LSS synthesized.
Download figure:
Standard image High-resolution imageThe diameter of the crystal is calculated according to Scherrer formula. Crystal diameter of MgSrFNaHAp coatings is about 29.5 nm, smaller than that of NaHAp (44.2 nm). This can be explained that the radius of  ion
ion  is smaller than that of
 and the radius of
  ion
ion  is smaller than that of
 . Although the radius of
  ion
ion  is larger than those of
  and
and  , but the replace of
  is much less than that of
  for
for  . Therefore, when OH− group is replaced by F− ion and
  is replaced by
  ,
,  ions, the crystal diameter reduced. Moreover, table 3 presents distance between the planes of the crystal (d) at two planes (0 0 2) and (2 1 1) and the values of the lattice parameters
  of NaHAp and MgSrFNaHAp. These values are low in comparision with NIST standard of HAp sample [29]. These results show that
  and
and  ions incorporated into the HAp lattice structure.
Table 3. Values of distance between the planes of the crystal  (0 0 2),
  (2 1 1) and the value of the lattice constants
  of MgSrFNaHAp.
| HAp [29] | NaHAp | MgSrFNaHAp | |
|---|---|---|---|
 (0 0 2) (0 0 2) |
3.440 | 3.438 | 3.435 |
 (2 1 1) (2 1 1) |
2.820 | 2.815 | 2.783 |
 |
9.445 | 9.426 | 9.299 |
 |
6.880 | 6.876 | 6.870 |
Beside, values of adhesion strength of NaHAp and MgSrFNaHAp show that the average adhesion strength of MgSrNaFHAp coatings is 8.38 MPa, higher than that of NaHAp coatings (7.16 MPa). This result demonstrates clearly that the presence of  and
and  ions creates the denser coatings and higher crystallinity than NaHAp coatings.
SEM images of obtained coatings in SNa, SMg, SF, SSr and SMgSrFNa solutions are shown in figure 7. The presences of Mg, F and Sr affect significantly to the morphology of coatings. In SNa solution, NaHAp obtained coatings have plate shapes with a large size. Plate and rod shapes of MgHAp coatings are observed when they synthesized in SMg solution. With the presence of strontium, the surface morphology of SrHAp changed from plate shapes to petiole shapes in comparison with NaHAp coatings. The obtained FHAp coatings have cylinder shapes with the presence of fluorine. The SEM images are clearly that MgSrFNaHAp/316LSS coatings have cylinder shapes with the smallest size.
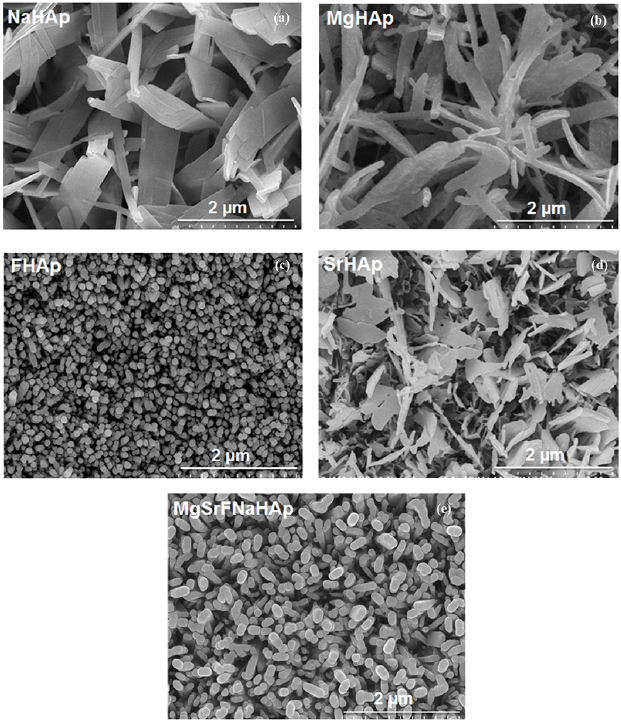
Figure 7. The SEM images of doped HAp obtained coatings in SNa, SMg, SF, SSr and SMgSrFNa solutions.
Download figure:
Standard image High-resolution image3.4. Dissolution behavior
The dissolution behaviors of MgSrFNaHAp and NaHAp coatings in physiological saline solution (0.9% NaCl) were shown in figure 8.
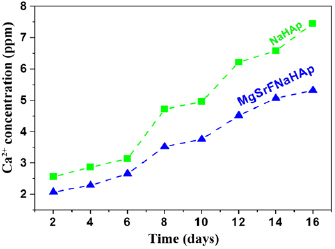
Figure 8. Dissolution behaviour of electrochemical deposited MgSrNaFHA and NaHAp coatings.
Download figure:
Standard image High-resolution imageThe concentrations of  ions dissolved from these coatings were determined after immersion from 2 days to 16 days. For all samples, the dissolved amounts of
  ions increase following immersion time. The MgSrFNaHAp coatings dissolved more slowly than the NaHAp coatings at any time. It is clearly that the dissolution of the coatings decreases with the presence of the trace elements.
3.5. In vitro test
3.5.1. The variation of the pH value.
The pH values of the SBF solution containing 316LSS, NaHAp/316LSS or MgSrFNaHAp/316LSS following the immersion time at  are shown in figure 9. The pH value of the SBF solution before soaking is 7.33. During the immersion time, the pH values of the SBF solution changed for different samples.
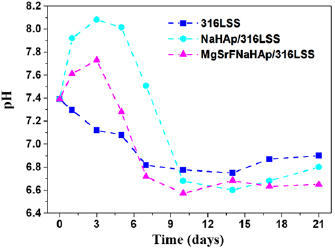
Figure 9. The variation of the OCP versus different immersion times in SBF solution.
Download figure:
Standard image High-resolution imageWith 316LSS sample, the pH solution decreases after 14 immersion days and trend increases lightly after 17 and 21 immersion days. With MgSrFNaHAp/316LSS and NaHAp/316LSS, pH value increases in the three first immersion days, then it decreases strongly after ten immersion days. The change of pH can be explained that there are two major processes to occur during the immersion: HAp dissolution and apatite precipitation. The dissolution HAp causes the exchange of  and
and  , therefore,
  ions are accumulated gradually in SBF solutions and lead to increase pH solution. In the process of forming apatite,
  as
as  ,
,  is consumed large quantities leading to reduce pH in solution.
In the time of ten immersion days, pH value of the SBF solution containing HAp/316LSS is always higher than that of the SBF solution containing MgSrFNaHAp/316LSS. The results show that when the dissolution of HAp/316LSS coatings is faster than that of MgSrFNaHAp/316LSS coatings in SBF solution.
3.5.2. The OCP.
The strong fluctuation of OCP of 316LSS, NaHAp/316LSS and MgSrFNaHAp/316LSS in SBF solution during immersion time is shown in figure 10. The OCP of MgSrFNaHAp/316LSS is always higher than that of NaHAp/316LSS and 316LSS, this exhibited that both of the coatings have the protection ability for the 316LSS substrates and the MgSrFNaHAp coatings can protect better for the substrates than that of NaHAp coatings.
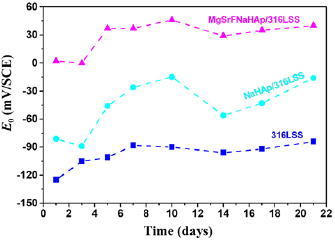
Figure 10. The variation of the OCP versus different immersion times in SBF solution.
Download figure:
Standard image High-resolution imageWith the uncoated 316LSS, OCP changes not much, it tends to increase during immersion time. OCP value of NaHAp/316LSS and MgSrFNaHAp/316LSS materials in SBF solution has fluctuation which shows the formation of new apatite crystals or the dissolution of the coatings. After 21 immersion days, the OCP moved to the positive potential side so the rate of the formation is higher than the rate of the dissolution of the coatings.
3.5.3. The electrochemical impedance.
Bode plots of 316LSS, NaHAp/316LSS, and MgSrFNaHAp/316LSS versus immersion time in the SBF solution are shown in figure 11. The impedance of uncoated 316LSS increases during 21 immersion days. The impedance of NaHAp/316LSS or MgSrFNaHAp/316LSS is higher than that of 316LSS because of protection ability of coatings.
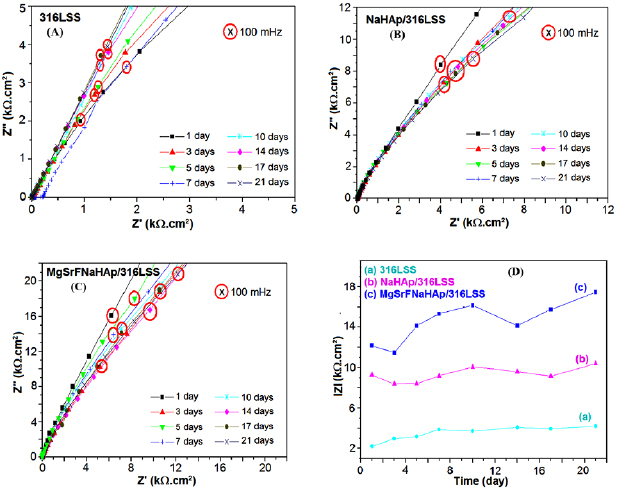
Figure 11. (A, B, C) Nyquist Bode plots and (D) the variation of impedance modulus at 100 mHz versus immersion time in SBF solution.
Download figure:
Standard image High-resolution imageThe variation of impedance modulus at 100 mHz frequency of 316LSS, NaHAp/316LSS and MgSrFNaHAp/316LSS samples according to immersion time is determined and shown in figure 11(D). The value of impedance modulus at the frequency 100 mHz characterized the formation of apatite on the materials and dissolution NaHAp/316LSS and MgSrFNaHAp/316LSS coatings.
With 316LSS, the impedance modulus trends to increase during immersion time and reaches about  after 21 immersion days. With NaHAp/316LSS and MgSrFNaHAp/316LSS samples, after one immersion day, the impedance modulus is 9.29 and
  , respectively. These values decrease lightly after 3 days then increases continuously in 10 days. With 14 immersion days, the impedance modulus decrease lightly, then increase and reach to
  of NaHAp/316LSS and
  of MgSrFNaHAp/316LSS after 21 immersion days. The impedance modulus of MgSrFNaHAp/316LSS is much higher than that of 316LSS and NaHAp/316LSS for any immersion time. These results are in good agreement with the above results at OCP and pH solution and further demonstrate the protection ability of MgSrFNaHAp coatings is better than that of NaHAp coatings.
3.5.4. Electrochemical corrosion test.
Figure 12 is shown the polarization curves of NaHAp/316LSS, MgSrFNaHAp/316LSS, and 316LSS after 21 immersion days in SBF solution. The values of corrosion current density  and the corrosion potential
  are calculated from the curves using Tafel extrapolation method and exhibited in table 4. In general, the values of
  are moved to the positive potential side because of the presence of the coatings. The
  of the MgSrFNaHAp/316LSS is about −0.258 V/SCE, while that of the NaHAp/316LSS is about −0.354 V/SCE and toward the positive side to −0.424 V/SCE of 316LSS uncoated.
Table 4. The values of  and
and  of 316LSS, NaHAp/316LSS and MgSrFNaHAp/316LSS.
| Material |  |
 |
|---|---|---|
| 316LSS | −0.424 | 2.773 |
| NaHAp/316LSS | −0.354 | 0.842 |
| MgSrFNaHAp/316LSS | −0.258 | 0.355 |

Figure 12. The polarization curves of 316LSS, NaHAp/316LSS and MgSrFNaHAp/316LSS.
Download figure:
Standard image High-resolution imageThis indicated that MgSrFNaHAp coatings can protect for the substrates better than that of NaHAp. This can also be demonstrated by the decreasing of  , which is about
  for MgSrFNaHAp/316LSS, it is 2.3 and 7.8 times lower than that for the NaHAp/316LSS and the bare 316LSS, respectively. So the effective protection for the substrates of NaHAp, MgSrFNaHAp coatings is 69.64 and 87.20%, respectively.
Obviously, apatite is formed high density on the surface of MgSrFNaHAp/316LSS after 21 immersed days (figure 12). So it reduces the specific surface area and plays a role as a barrier to protect the substrates against ions diffusion.
3.5.5. The SEM images.
The SEM images of 316LSS, NaHAp/316LSS, and MgSrFNaHAp/316LSS before and after 21 immersion days in SBF solution are shown that the thick block of new apatite crystals is formed on the surface of all materials (figure 13).

Figure 13. SEM images of 316LSS, NaHAp/316LSS and MgSrFNaHAp/316LSS before (on the left) and after (on the right) 21 immersion days in SBF solution.
Download figure:
Standard image High-resolution imageBefore immersion, the morphology of HAp/316LSS and MgSrFNaHAp/316LSS have plate shape and rod shape, respectively. After 21 immersion days, both of the samples have cactus-like shape. With 316LSS substrates, the crystals of apatite are formed with sphere shape.
3.5.6. Concentration of iron ion release.
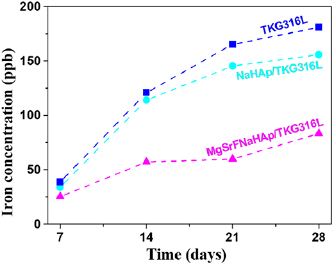
Figure 14 shows the level of iron ions release from 316LSS, NaHAp316LSS and MgSrFNaHAp/316LSS after immersion from 7 to 28 days in SBF solution. It was noticed that the release concentration of iron ions increases according to time for all of them. However, the iron ion release from the coated 316LSS is much less than that from the uncoated 316LSS and it is at least from MgSrFNaHAp coatings. This suggested that the present of NaHAp and MgSrFNaHAp coatings lead to decrease the dissolution of 316LSS and play as a barrier to protect the substrates. Furthermore, MgSrNaFHAp coatings have the ability to cover and protect the substrates better than NaHAp ones.
Figure 14. Variations of iron concentration released from 316LSS substrates after samples immersed in SBF solution.
Download figure:
Standard image High-resolution image
4. Conclusion
 and
and  are incorporated into HAp coatings on 316LSS by electrodeposition. The present of these trace elements with the suitable component in natural bone made the obtained coatings become denser, higher bonding strength, lower dissolution and protect the substrates better than pure HAp. The in vitro tests in SBF solution shows that after 21 immersion days, the thick block of apatite formed on the surface of MgSrFNaHAp/316LSS leading the corrosion current density decrease. In addition, the protection ability of substrates due to NaHAp and MgSrFNaHAp coatings is investigated by electrochemical impedance measurements at the OCP and during immersion times. Thus, the MgSrFNaHAp coatings with these desired characteristics will be applied effectively in implant materials.
Acknowledgment
This work was supported by the Vietnam Academy of Science and Technology (VAST) (under grant no. VAST.ĐLT.01/15-16), and the Hanoi Department of Science and Technology (under grant no. 01C-03/01-2015-2).