


Abstract
Nanocrystalline TiO2, because of its unique electronic and optical properties, stability, nontoxicity, etc, finds a wide range of applications including pigments, sunscreen materials, photocatalysts and catalysts. Although numerous transition metal oxides and sulfides and their combinations are reported as photocatalysts, their stability, nontoxicity, etc, have not been assessed for adoption by industries. So is the case with metal or metal ion-doped TiO2. Here we show that by coating anatase TiO2 over rutile TiO2 nanoparticles, without compromising the nontoxicity, stability, cost, etc, the charge transfer resistance, absorption edge, moisture-adsorption and photocatalytic activity are modified to suit different types of applications, such as UV light protection with moderation of photocatalytic activity to act as sunscreen materials and pollutant-degradation through photocatalysis. Anatase TiO2-coated rutile TiO2 nanoparticles were obtained by a particulate sol-gel technique. Coating of anatase over rutile blue-shifts the absorption edge, increases largely the charge transfer resistance and enhances the moisture-adsorption. Charge transfer resistance of anatase-coated rutile decreases under band gap illumination. The photocatalytic activity of the nanocrystalline anatase-rutile is less than that of pristine anatase but larger than that of pristine rutile. This study enables to adopt different phases of TiO2 for divergent applications.
Export citation and abstract BibTeX RIS
1. Introduction
Nanocrystalline TiO2 is a technologically important semiconducting material and because of its nontoxicity, high chemical stability, excellent biocompatibility, unique optical and optoelectronic properties [1, 2] and catalytic as well as photocatalytic activities [3, 4] it finds a wide range of applications in varied fields [5]. Mineralisation of organic pollutants [6, 7], hydrogen generation [8–10] and dye-sensitised solar cells are based on photocatalysis by TiO2. TiO2-based self-cleaning materials are available commercially [11]. The UV radiation in natural sunlight causes sunburns on prolonged exposure. TiO2 nanoparticles are non-allergenic, exhibit UV attenuation properties, act as an UV filter and constitute up to 25% in sunscreen formulations [12–14]. TiO2 nanoparticles do not penetrate beyond the stratum corneum and their absence of penetration into skin has been reported [15]; nano-TiO2 based sunscreen products are in markets for over two and a half decades. TiO2 is an active photocatalyst and generates reactive oxidising species (ROS) on exposure to UV light and moisture. Generation of detrimental ROS and free radicals is to be suppressed for the use of TiO2 in sunscreen formulations [15, 16]. Although numerous nanocrystalline transition metal oxides and sulfides and their combinations are reported as photocatalysts, their toxicity, stability including photostability, cost, etc, have not been assessed for practical applications [17]. The band gap and the photocatalytic activity are engineered through metal or metal ion-doping of TiO2 but the nontoxicity of doped TiO2 has not been established. Anatase TiO2 and rutile TiO2 differ in their band gap energies (3.2 and 3.0 eV, respectively) and band potentials [3, 18]. Anatase blended rutile TiO2 nanoparticles, such as TiO2 P25 Degussa, show enhanced photocatalytic activity [19]. Since undoped TiO2 is innocuous, it is of technological as well as commercial interest for sunscreen and photocatalytic applications. The present work shows that the electrical, optical and photocatalytic properties are tuned through the combination of anatase and rutile phases of TiO2, via adopting a suitable synthetic procedure, for divergent applications such as photocatalytic degradation of organic pollutants and UV light protection as sunscreen materials.
2. Experimental
2.1. Particulate sol-gel synthesis
Polyethylene glycol (molecular weight 4000, 2 g) was dispersed homogeneously in cyclohexanone (20 ml) under stirring (30 min). Rutile TiO2 nanocrystals (Sigma-Aldrich, 0.5 g) were added under stirring and the stirring was continued for another 30 min. For the rutile TiO2 dispersion, titanium isopropoxide (2 ml) in isopropyl alcohol (10 ml) was added followed by aqueous ethanol (1:1). The stirring was continued for 30 min to get a gel. The gel was filtered, dried at 120 °C in a hot air oven for 5 h and calcined at 500 °C for 2 h in a muffle furnace equipped with a PID temperature controller; the heating rate was 10 °C min−1. TiO2 anatase (Sigma-Aldrich) was used as received.
2.2. Characterisations
A PANalytical X'Pert PRO diffractometer was used to record the powder x-ray diffractograms. The 2θ range was 20–70° and the scan speed was 0.04° s−1. Cu Kα rays with 0.154 06 nm wavelength was employed at 40 kV and the tube current was 30 mA. A Quanta-200 FEI high resolution scanning electron microscope (HRSEM) with an energy dispersive x-ray (EDX) unit attachment was used under high vacuum mode to obtain the HRSEM image and the energy dispersive x-ray spectrum (EDS). The ultraviolet (UV)-visible diffuse reflectance spectra (DRS) and the photoluminescence (PL) spectrum were obtained with a PerkinElmer Lamda 35 spectrometer and PerkinElmer LS 55 fluorescence spectrometer, respectively. To record the PL spectrum, the sample dispersed in carbon tetrachloride was excited at 340 nm. A CH Instruments electrochemical analyser 604C was used to record the solid state electrochemical impedance spectra at 0.1 MHz to 1 Hz in air at 25 °C. The nanopowders were pelletised and the pellet area was 0.5024 cm2. For photo-impedance study the nanocomposite pellet was placed vertically to allow maximum light exposure and the illumination was with a 150 W tungsten halogen lamp. The synthesised anatase-coated rutile TiO2, rutile TiO2 nanocrystals (Sigma-Aldrich) and TiO2 anatase (Sigma-Aldrich) were dried in a hot air oven and stored in a desiccator. An identical quantity of each nanomaterial was ground well with an identical quantity of spectroscopic grade KBr crystals and pelletised to record the infrared (IR) spectra. An Avatar 330FT-IR spectrometer was used to obtain the Fourier-transform IR spectra.
2.3. Photocatalytic test
The photodegradation of rhodamine B dye was examined using a Heber multilamp photoreactor with four 8 W medium pressure mercury lamps (Sankyo Denki, Japan) as the light source. The lamps were erected mutually at right angles and enclosed by a highly polished aluminium reflector. Cooling fans at the bottom of the reactor helped to dissipate the heat generated. A borosilicate glass tube with 15 mm inner diameter was used as the reaction vessel. It was placed at the center of the photoreactor. The photon flux of the light source (25.4 μEinstein l−1 s−1) was determined by ferrioxalate actinometry. Solutions of rhodamine B of desired concentration were prepared afresh and used. On addition of the nanoparticles (20 mg) to the dye solution (25 ml) in the reaction tube, air was bubbled to keep up the nanoparticles under suspension and at a constant motion. The airflow rate (7.8 ml s−1) was measured by soap bubble method and the dissolved oxygen in the test solution (9.3 mg l−1) was determined with an Elico dissolved oxygen analyser PE 135. The measured pH of the dye solution was 5.5. After illumination, the nanoparticles were recovered by centrifuge and the dye was analysed spectrophotometrically, after proper dilutions. The absorbance at 555 nm was used to estimate the undegraded dye; a calibration curve was drawn by measuring the absorbance of the dye solution of different ppm at the stated wavelength.
3. Results and discussion
3.1. Crystalline structure
Figure 1 presents the recorded powder XRD patterns of the synthesised anatase-coated rutile TiO2. It confirms the presence of both anatase and rutile phases of TiO2 in the sample. The recorded XRD matches with the standard JCPDS patterns of anatase TiO2 (89–4203, tetragonal, body centered, a = b = 0.3785 nm, c = 0.9514 nm, α = β = γ = 90.0°) and rutile (89-4920, tetragonal, primitive, a = b = 0.4584 nm, c = 0.2953 nm, α = β = γ = 90.0°). The phase percentages of anatase and rutile in the synthesised sample have been deduced from the integrated intensity of the 2θ-peak of anatase at 25.3° and that of rutile at 27.4°. The percentage of anatase is given by A (%) = 100/[1 + 1.265(IR/IA)], where IA is the intensity of the anatase 1 0 1 peak at 25.3° and IR is that of the rutile 1 1 0 peak at 27.4°. The phase composition thus obtained is 56% anatase and 44% rutile. Figure 1 also displays the XRD pattern of rutile TiO2 precursors used for the synthesis. It matches with that of the standard rutile TiO2 (JCPDS no. 89–4920 was the reference adopted). The crystalline structure of anatase TiO2 used for the study was ascertained by powder XRD [20].

Figure 1. (left) XRD patterns of (i) synthesised TiO2 sample showing anatase and rutile crystalline phases and (ii) pristine rutile TiO2 confirming its lattice, (right) EDS spectrum of the obtained sample exhibiting the presence of titanium and oxygen only and HRSEM image of the sample revealing the nanoparticulate character.
Download figure:
Standard image High-resolution imageFigure 1 also displays the EDS spectrum of the synthesised sample. It shows the presence of titanium and oxygen only. The unlabelled peak is that of aluminium foil employed. The HRSEM image under high vacuum mode, displayed also in figure 1, shows the synthesised sample as nanoparticles. The particles were highly agglomerated. The mean size of nanocrystals (D) has been deduced using the Scherrer equation D = kλ/β cosθ, where λ is the wavelength of x-ray used, θ is the Bragg diffraction angle, β is the full width at half maximum of the most intense peak and k is the shape factor. For approximately spherical shapes k takes a value of 0.9. The mean crystallite sizes of anatase-coated rutile TiO2, pristine rutile TiO2 and pristine anatase TiO2 are 10.6, 11.5 and 9 nm, respectively. The specific surface area (S) of nanocrystals has been obtained using the relationship S = 6/ρD, where ρ is the material density and D is the mean crystallite size. The specific surface areas of anatase-coated rutile, pristine rutile and pristine anatase TiO2 nanocrystals are 132, 123 and 165 m2 g−1, respectively.
3.2. Band gap
UV-visible DRS of anatase-coated rutile TiO2, pristine rutile TiO2 and pristine anatase TiO2 are presented in figure 2 (a). The DRS have been obtained from the recorded reflectance (R) by application of Kubelka-Munk (K-M) algorithm, F(R) = (1 − R)2/2R. A Tauc plot of [F(R)hν]½ versus hν provides the band gap of the synthesised nanocomposite TiO2 (figure 2 (b)). The deduced band gap energies of anatase-coated rutile TiO2, pristine rutile TiO2 [21] and pristine anatase TiO2 [21] are 3.05, 3.03 and 3.22 eV, respectively. They correspond to absorption edges of 406, 409 and 385 nm, respectively. These results clearly show that coating of anatase over rutile blue-shifts the absorption edge of TiO2. In other words, deposition of anatase on rutile TiO2 nanocrystals increases the band gap energy. Rutile TiO2 and anatase coated rutile TiO2 absorb visible light whereas anatase TiO2 does not.

Figure 2. (a) UV-visible DRS of anatase-coated rutile, rutile and anatase TiO2 nanoparticles, (b) the band gap of anatase-coated rutile TiO2 nanoparticles, (c) the PL spectrum of nanoparticulate anatase/rutile TiO2 and (d) Nyquist plots displaying charge transfer resistances of anatase-coated rutile, rutile and anatase TiO2.
Download figure:
Standard image High-resolution image3.3. Photoluminescence
The PL spectrum of anatase-coated rutile TiO2 nanoparticles is presented in figure 2 (c). It is akin to that of anatase TiO2 nanocrystals [22, 23]. The mixed phase TiO2 nanoparticles exhibit the band gap emission as well as deep level emission (DLE). The near band gap emission (NBE) occurs at 402 nm. It is due to the radiative recombination of photogenerated conduction band (CB) electrons with valence band (VB) holes. The observed NBE is in close agreement with the determined band gap energy. The DLE comprises of a violet band centered at 421 nm, strong blue band at around 458 nm, blue-green band at about 482 nm and weak green band at ∼528 nm. The blue-green emission (482 nm) and green emission (528 nm) are attributed to the electron transition from oxygen vacancies with two trapped electrons and one trapped electron to VB [24]. The energy levels of the two types of oxygen vacancies are 0.51 and 0.82 eV lower than the CB edge of TiO2. These oxygen vacancy energy levels enable the CB electron to slip to either of the vacant energy levels through a non-radiative process. The union of electrons in either of the oxygen vacancies with the VB hole through a radiative process yields blue-green and green emissions. The blue-green emission is bound-exciton emission and is also attributed to trapping of free excitons near defects [25]. Charge-transfer transition from Ti3+ to the oxygen anion of  octahedra associated with oxygen vacancies at the surface is said to be a reason for the observed blue-green emission [25, 26]. The violet emission is attributed to self-trapped excitons localised on the TiO6 octahedra [25, 26]. The strong blue emission is ascribed to the radiative recombination of excitons of the shallow traps identified with oxygen vacancies and Ti4+ adjacent to oxygen vacancies [27]. The green emission is associated with oxygen vacancies and other vacancy related defects [28]. This emission energy corresponds to the electron transition from deep level donor of ionised oxygen vacancy to the VB [28].
3.4. Charge transfer resistance
A large number of constituent ions of a nanostructured semiconductor reside in the grain boundary and within a couple of layers from the boundary. These grain boundaries possess a high density of defects such as vacancies. These defects strongly influence the electrical properties of semiconductor nanostructures. Semiconductor-photocatalytic activity is highly influenced by the electrical properties of semiconductor. Solid state impedance spectroscopy (SSIS) is a powerful technique to probe the electrical properties of semiconductor nanomaterials [29]. The dynamics of mobile and bound charges in the bulk and interfacial region of semiconductor are explored through SSIS. The overall resistance of a polycrystalline semiconductor is a combination of bulk (intragranular) resistance and grain boundary (intergranular) resistance. Impedance measurements with nanocrystalline (i) anatase-coated rutile TiO2, (ii) pristine rutile TiO2 and (iii) pristine anatase TiO2 reveal a decrease of impedance with an increase of frequency. This shows the capacitance of the three studied nanocrystalline TiO2. A most popular method for analysis of impedance spectra is through Nyquist plots and figure 2 (d) presents the plots of the three TiO2 nanomaterials. A specific combination of capacitors and resistors constitutes an electric circuit and fitting the SSIS data to an equivalent circuit affords the electrical properties. The observed semicircular plots are the expected response of a simple circuit [29]. The uncompensated resistance, known as ohmic resistance (RΩ), corresponds to the intergranular or grain boundary resistance. The bulk crystal resistance, also called intragranular resistance, refers to the charge transfer or polarisation resistance (RCT). The RCT is associated with the Warburg resistance and is governed by the specific conductance (σ). The constant phase element stems from a non-uniform distribution of current because of the material heterogeneity and corresponds to a double layer capacitance (C). Figure 2 (d) shows that the RCT of anatase-coated rutile TiO2 nanoparticles is much larger than those of rutile and anatase TiO2 nanocrystals. This is because of the anatase/rutile heterojunction. The (i) RΩ, (ii) RCT, (iii) σ and (iv) C of nanoparticulate anatase-coated rutile TiO2, rutile TiO2 and anatase TiO2 are (i) 66, 53 and 12 kΩ, (ii) 9.79, 5.03 and 2.76 MΩ, (iii) 4.17, 6.73 and 15.1 μS m−1 and (iv) 245, 0.0085 and 868 nF, respectively.
3.5. Charge transfer resistance under illumination
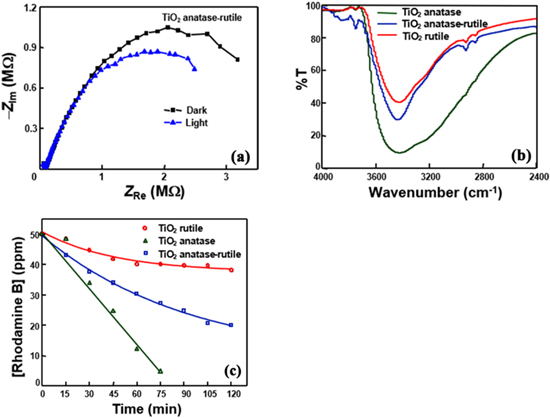
Semiconductors under band gap excitation lead to the promotion of electrons from VB to CB. This electron movement under illumination of the light having energy not less than the band gap is to reflect on the charge transfer resistance of the material. Figure 3 (a) shows the Nyquist plots of anatase-coated rutile TiO2 nanoparticles obtained under (i) dark and (ii) band gap illumination. Band gap illumination decreases the charge transfer resistance of the synthesised novel composite. This confirms the excitation of electrons from VB to CB under illumination with the energy of light not less than the band gap. In other words, it confirms the creation of charge carriers under band gap illumination.
Figure 3. (a) Nyquist plots of anatase/rutile TiO2 under (i) dark and (ii) band gap-illumination, (b) FT-IR spectra showing moisture absorption by anatase/rutile, rutile and anatase TiO2 nanoparticles and (c) the dye-degradation profiles with anatase/rutile, rutile and anatase TiO2 nanoparticles.
Download figure:
Standard image High-resolution image
3.6. Moisture adsorption
Semiconductors under band gap illumination generate charge carriers. These charge carriers would diffuse toward the crystal surface to react with the adsorbed moisture (water) and atmospheric oxygen to produce reactive oxygen species (ROS) which are responsible for photocatalysis. Therefore, adsorption of moisture (water) by semiconductors may also influence the photocatalytic activity. Figure 3 (b) displays the FT-IR spectra of anatase-coated TiO2, rutile TiO2 and anatase TiO2, recorded under identical conditions. The IR spectra show a decrease of the moisture-adsorption with a decrease of the anatase composition; the observed moisture adsorption follows the order: rutile TiO2 < anatase-coated rutile TiO2 < anatase TiO2.
3.7. Photocatalytic activity
Photocatalytic activities of nanoparticulate anatase-coated rutile TiO2, pristine rutile TiO2 and pristine anatase TiO2 have been tested through degradation of rhodamine B dye using medium pressure mercury lamps as the light source. Figure 3 (c) presents the dye degradation profiles. It shows that the photocatalytic activity of anatase-coated rutile TiO2 is larger than that of pristine rutile TiO2 but is less than that of pristine anatase TiO2. The band edges of anatase and rutile TiO2 differ and the anatase/rutile heterojunction is to favour the separation of photogenerated charge carriers [19], which helps to enhance the photocatalytic activity. Therefore, the photocatalytic activity of anatase-rutile blended TiO2 such as Degussa P25 is larger than those of pristine anatase TiO2 and rutile TiO2. Such results have been reported widely [19]. But the present results are contradictory. One of the preliminary explanations is that Degussa P25 is a mixture of anatase and rutile nanoparticles whereas in the present study the anatase deposited rutile is a nanoparticulate composite. ROS, responsible for photocatalysis, are generated from water and oxygen molecules adsorbed on the semiconductor surface and the moisture adsorption counts for photocatalysis. Moisture adsorption by anatase/rutile TiO2 is larger than that by pristine rutile TiO2 but less than that by pristine anatase TiO2. This order is in agreement with the observed photocatalytic activities of the studied TiO2 nanomaterials. The determined dye-degradation activities are also in line with the deduced specific surface area of the three TiO2s. However, the observed photocatalytic activities do not directly correlate with either RCT or C indicating that the relationship is complex.
4. Conclusions
The results of this study show that the band gap, charge transfer resistance, capacitance, moisture adsorption, etc, are tuned by modifying the crystalline structure of TiO2. Coating of anatase over rutile TiO2 nanocrystals blue-shifts the absorption edge and the formation of anatase/rutile heterojunction provides a larger charge transfer resistance. Solid state impedance spectroscopic study under illumination confirms the photogeneration of charge carriers in anatase-coated rutile TiO2. Rutile TiO2 is good for sunscreen formulations and anatase TiO2 is suitable for photocatalytic decontamination of pollutants. Anatase-coated rutile TiO2 nanoparticles display moderate photocatalytic activity and are suitable for sunscreens as well as photocatalytic dye-degradation applications.
Acknowledgments
Financial support from the Council of Scientific and Industrial Research (CSIR), New Delhi, under the Emeritus Scientist Scheme [21(0887)/12/EMR-II] is acknowledged.